

This week was very intense in terms of price action and we take a look at Ethereum, Ripple, Cardano, Binance Coin, and Polkadot.
Ethereum
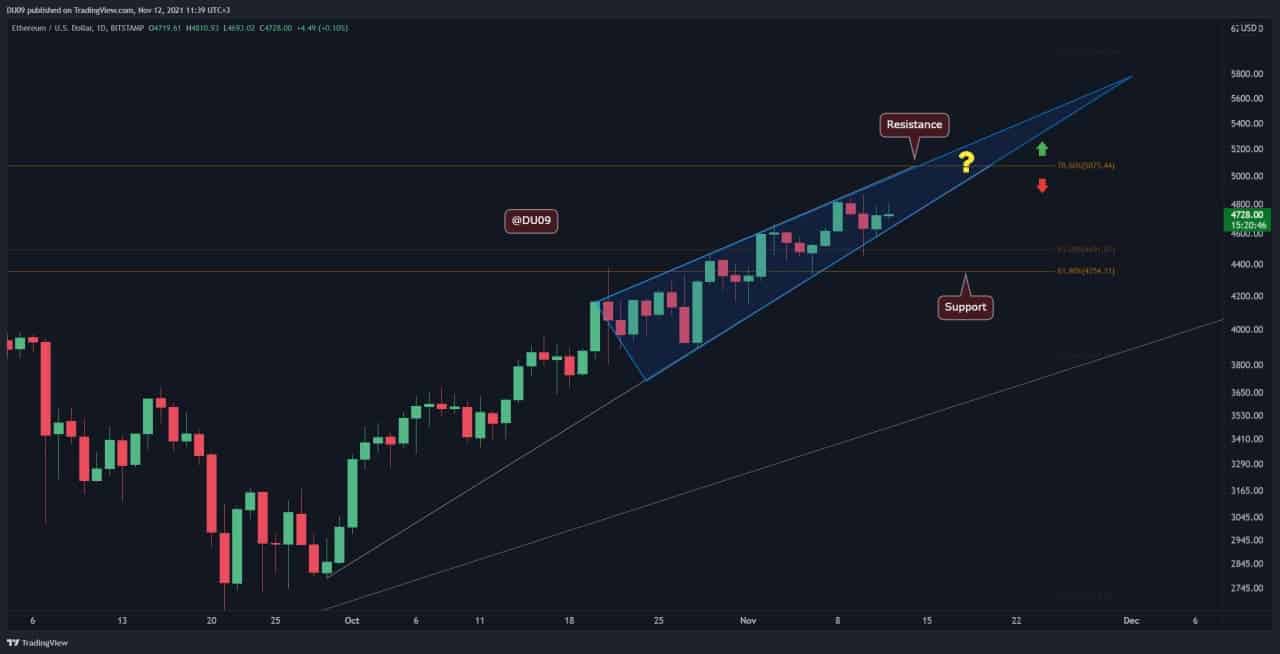
Ethereum has set another all-time high this week at $4,868 and increased slightly.
ETH is currently sitting on a clear uptrend and has formed a large bearish wedge which appears to end just above $5,000 (in blue). This is also the place where ETH has key resistance at $5,075. Therefore, the current rally may be stopped by the bears at that level, even if temporary. If this scenario plays out, ETH might pull back towards $4,500 before the rally can continue.
This is also supported by the indicators, where the daily MACD did a bearish cross today. This is not good news for the bulls as it indicates the possibility of a correction in the future. Nevertheless, it’s looking more likely for ETH to first test the resistance before any sharp rejection.
Looking ahead, ETH is one of the strongest performers this year, therefore, this could continue in the future. It remains very bullish on higher timeframes, despite any short-lived pullbacks. So long as the overall crypto market remains bullish, ETH can continue to make higher highs.
Ripple
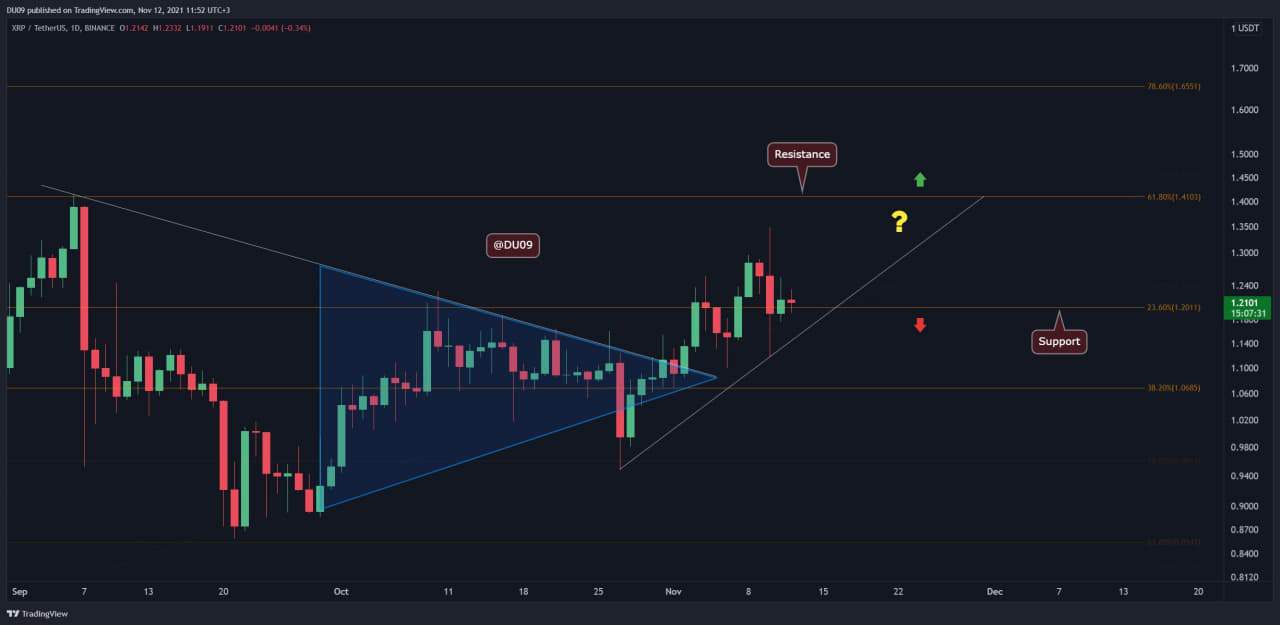
XRP had an exciting week with high volatility but failed to maintain its price above $1.2 which is currently acting as support. In the last seven days, the price decreased by only 2%, despite reaching almost $1.34 for a brief moment. Nevertheless, the bias on XRP is bullish and so long it holds above the $1.2 support level, the expectation is to see XRP attempt again to break above the $1.4 resistance.
The bears were quite fast to reject XRP’s attempt at a rally, but they failed to push the price under $1.2 which currently acts as the baseline for next week’s price action. The daily timeframe indicators remain positive, but the bulls need to step up in the coming week as well, otherwise, XRP will hover around $1.2 as before.
Looking ahead, XRP needs to pass beyond the $1.4 resistance if there is hope to see higher prices in the longer term. As such, a break above that level would be a strong indicator that XRP is ready to move higher.
Cardano
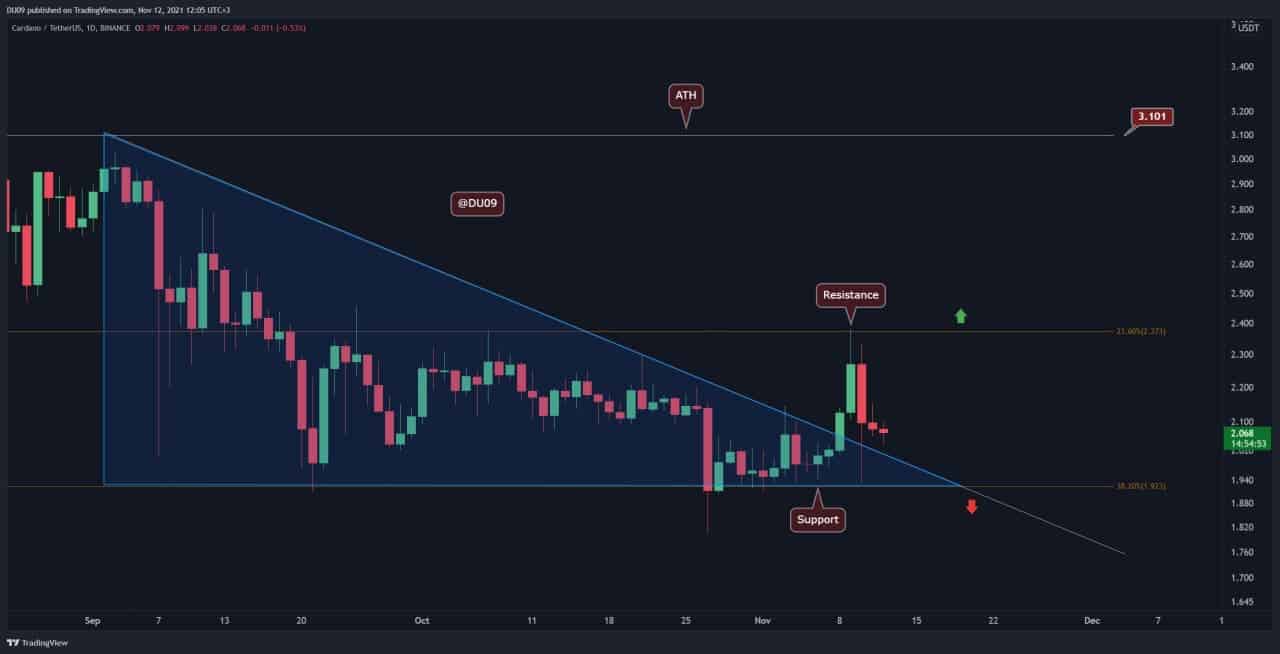
ADA made a significant break above the descending triangle this week and reached the resistance at $2.4 where it was sharply rejected by the bears. Since then, ADA’s price fell back to the breakout point leading to only a 1.8% increase in the past seven days. This reversal is quite unfortunate and shows that the bulls were only interested in ADA during the breakout and quickly vanished as soon as they hit any resistance.
ADA is still stuck between the support at $1.9 and the resistance at $2.4. Nevertheless, with this breakout, it did achieve one important aspect. It stopped the bearish trend.
Looking ahead, ADA can consolidate within this range before another attempt is made to break away from the $2.4 resistance. Once that happens, ADA has a good chance to explore higher price levels. Until then, the bias for ADA remains neutral.
Binance Coin
After a fantastic rally in the last two weeks, BNB nearly reached its all-time high this week, which sits at $692. However, the bears stepped in and stopped the increase just before that key level. Despite this, BNB had a good week and increased by 9.7%.
BNB has found good support at $600 where the bears were unable to push prices lower. This support is expected to hold in the nearby future as BNB may attempt another break of the all-time high resistance. The bias also remains bullish as long as BNB manages to hold the price above the key support level.
Looking ahead, BNB should continue to have a strong performance as long as the overall market remains bullish. BNB has also managed to break above the $100 billion market capitalization this week and sustain this level, which is a significant milestone.

Polkadot
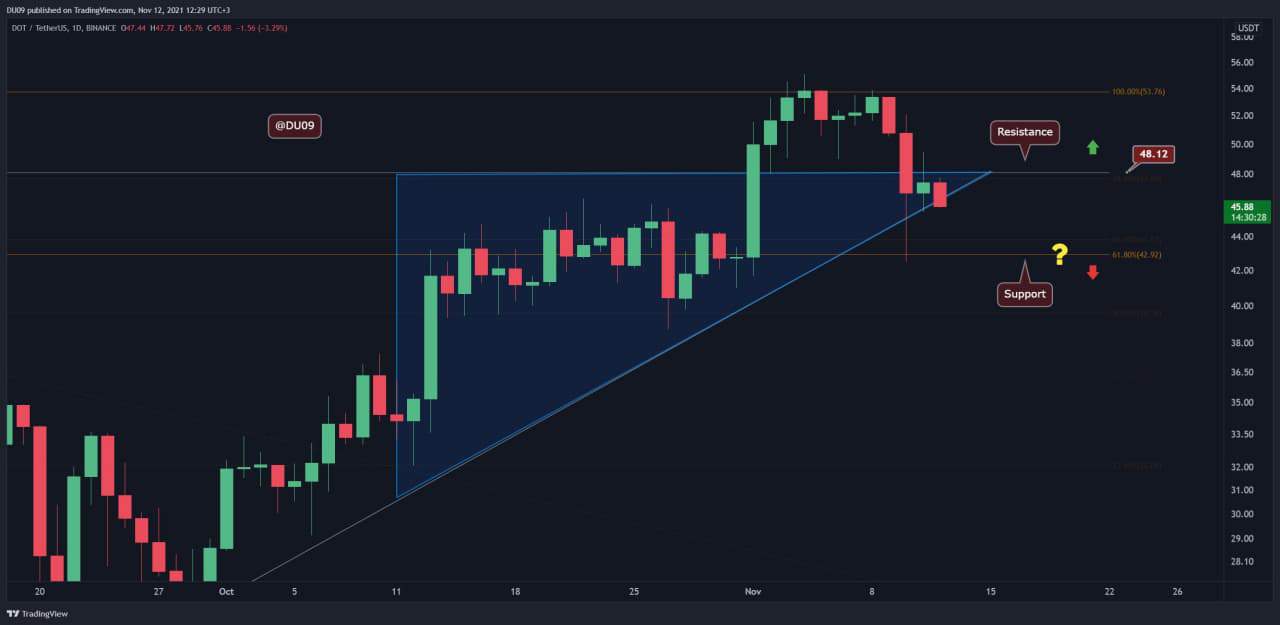
DOT disappointed this week with a 15% drop in the past seven days. Moreover, it did not manage to hold above the support level at $48, falling behind it and turning it ito resistance.
These are bearish signals, with MACD crossing on the negative side on the daily timeframe. When this happens, it is time to expect a correction and DOT is not different in this respect, particularly after a strong rally in October and early November that lead to a new all-time high at $55.
The next support level is found at $43 which should be well defended by bulls. Looking ahead, expect to see DOT approach the low $40s before the bulls may return to defend further losses in price.
Binance Free $100 (Exclusive): Use this link to register and receive $100 free and 10% off fees on Binance Futures first month (terms).
PrimeXBT Special Offer: Use this link to register & enter POTATO50 code to get 50% free bonus on any deposit up to $1750.
Disclaimer: Information found on CryptoPotato is those of writers quoted. It does not represent the opinions of CryptoPotato on whether to buy, sell, or hold any investments. You are advised to conduct your own research before making any investment decisions. Use provided information at your own risk. See Disclaimer for more information.
Cryptocurrency charts by TradingView.
 Bitcoin
  Ethereum
  Tether
  BNB
BNB  USDC
USDC  XRP
XRP  Solana
  TRON
TRON  Figure Heloc
  Hyperliquid