

– Support zones can often be difficult to identify.
– The Ichimoku Kinko Hyo system provides fantastic levels of support.
Cardano (ADA)
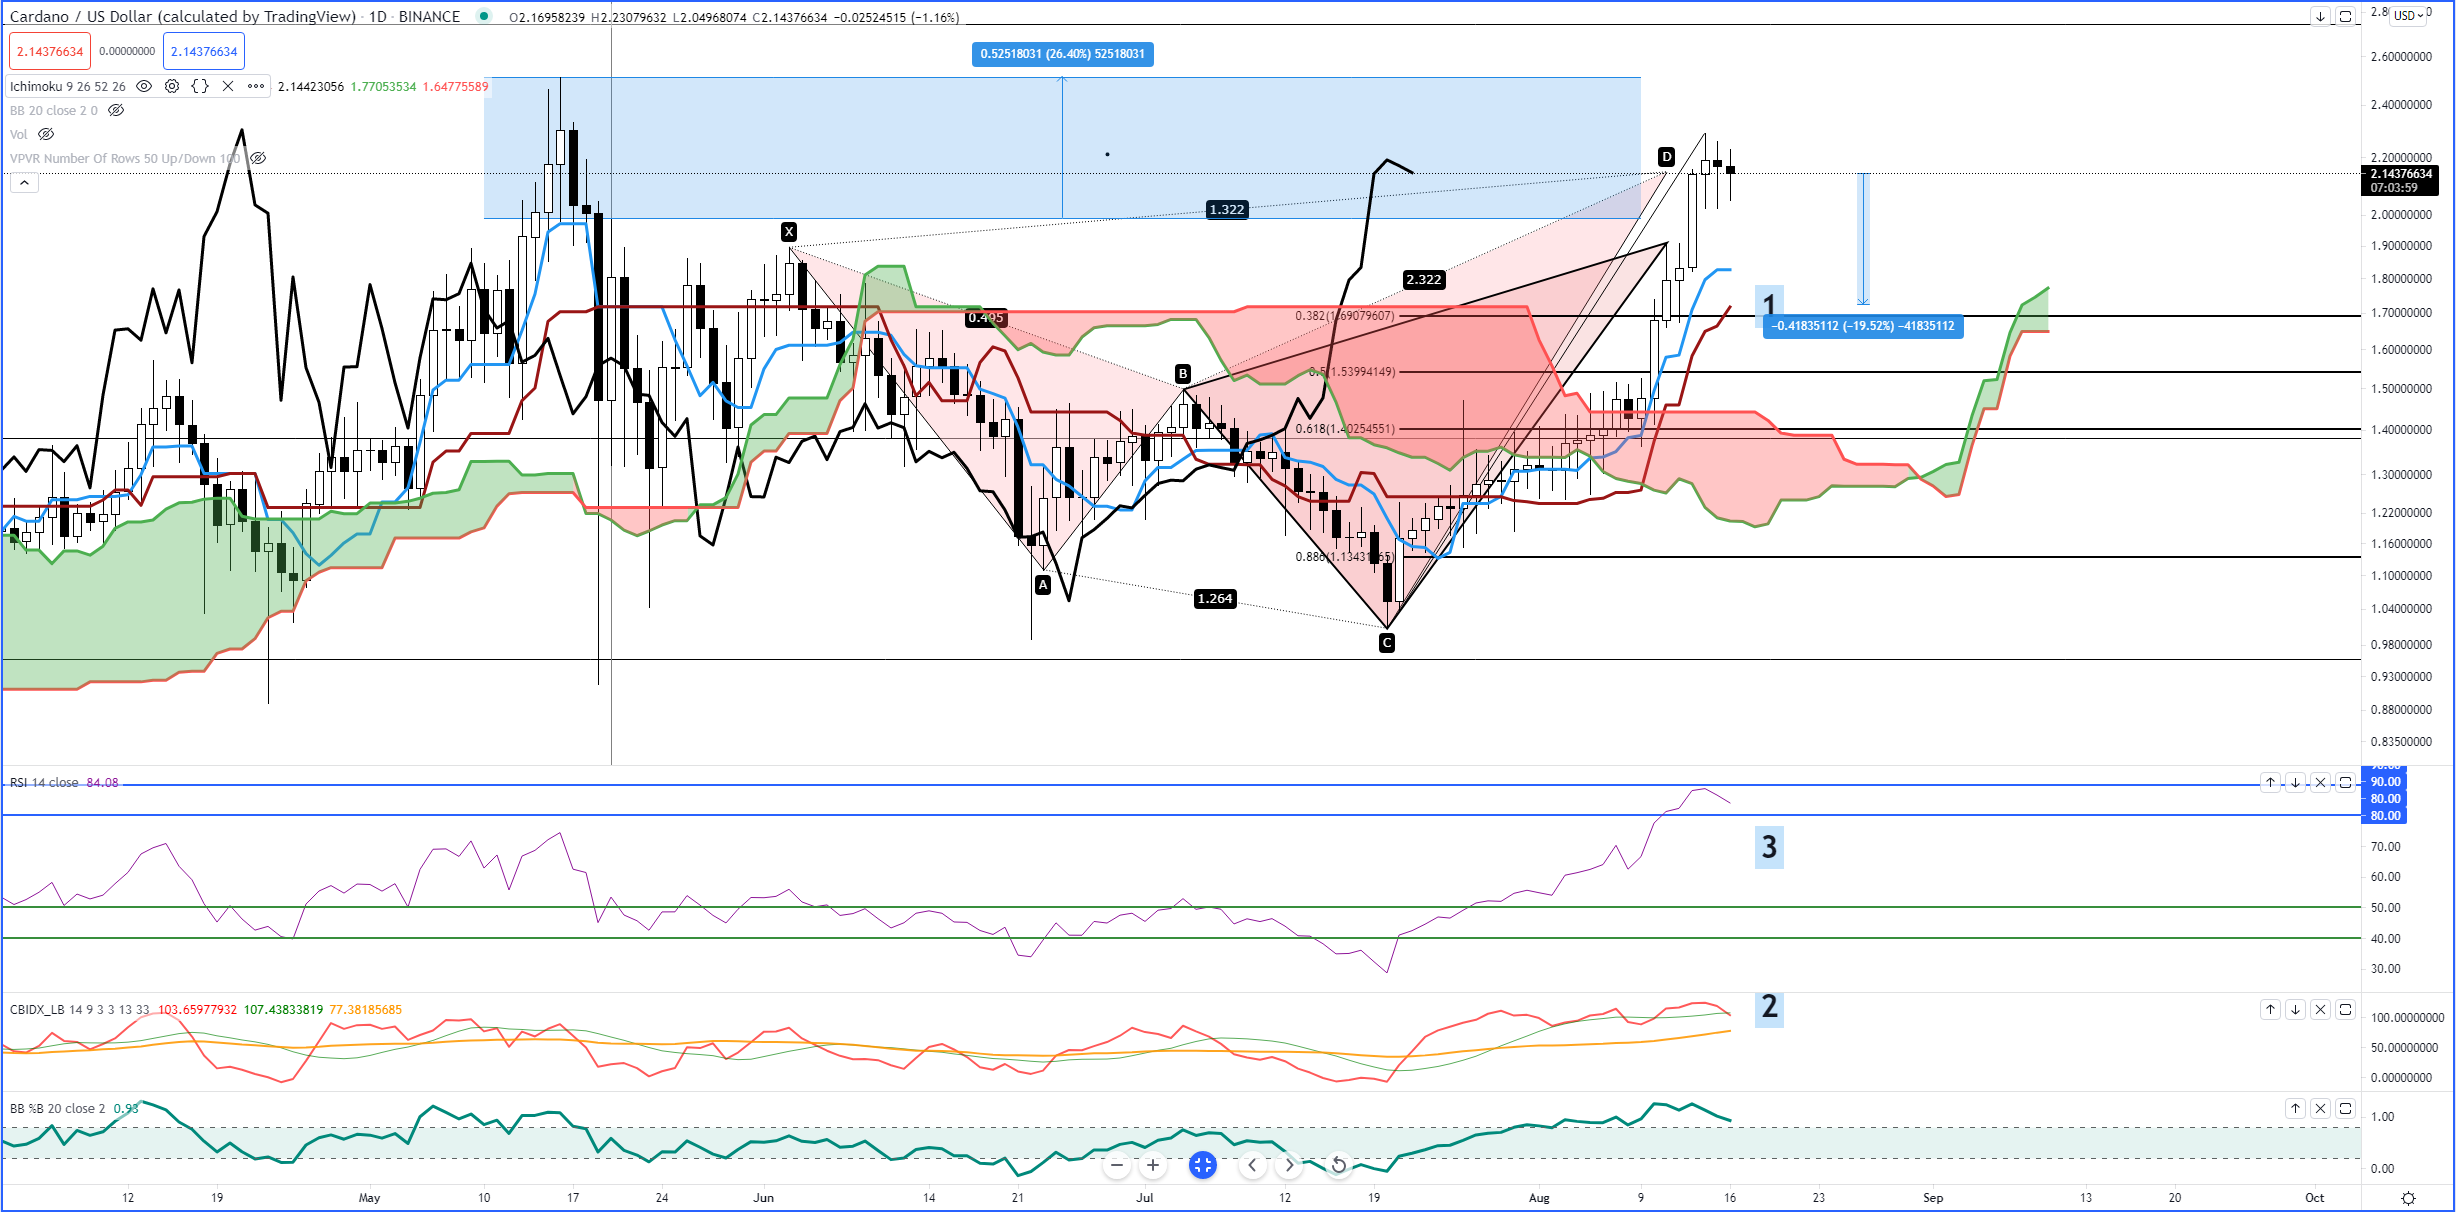
Above: Cardano (ADAUSD)
When I look at Cardano’s daily chart above, I notice one glaring condition: significant and consecutive gaps between the daily close and the Tenkan-Sen (#1). It is rare for price to not correct back to the Tenkan-Sen when a significant gap occurs. The RSI (#3) is setup with the overbought and oversold levels used in a bull market. The final overbought level is 90 and Cardano was just recently trading near that range this past weekend. The RSI is currently sloping lower. The sign that I see an imminent pullback occurring is not just the slope of the RSI, but what is happening on the Composite Index (#2). The Composite Index has crossed below its fast average (green moving average). Because I expect the gap between the daily close and the Tenkan-Sen to fill, the support zone I would expect it to find is between the daily Tenkan-Sen and Kijun-Sen (1.82 and 1.71, respectively). The ideal condition I would like to see if Cardano moves down to either of those levels is for the Composite Index to form a lower trough, thereby creating hidden bullish divergence and helping confirm support at/near the Tenkan-Sen and Kijun-Sen. For dip buyers, a move to either the Tenkan-Sen or Kijun-Sen as support would represent a 15% to 20% discount from the present trading value.
Stellar (XLM)
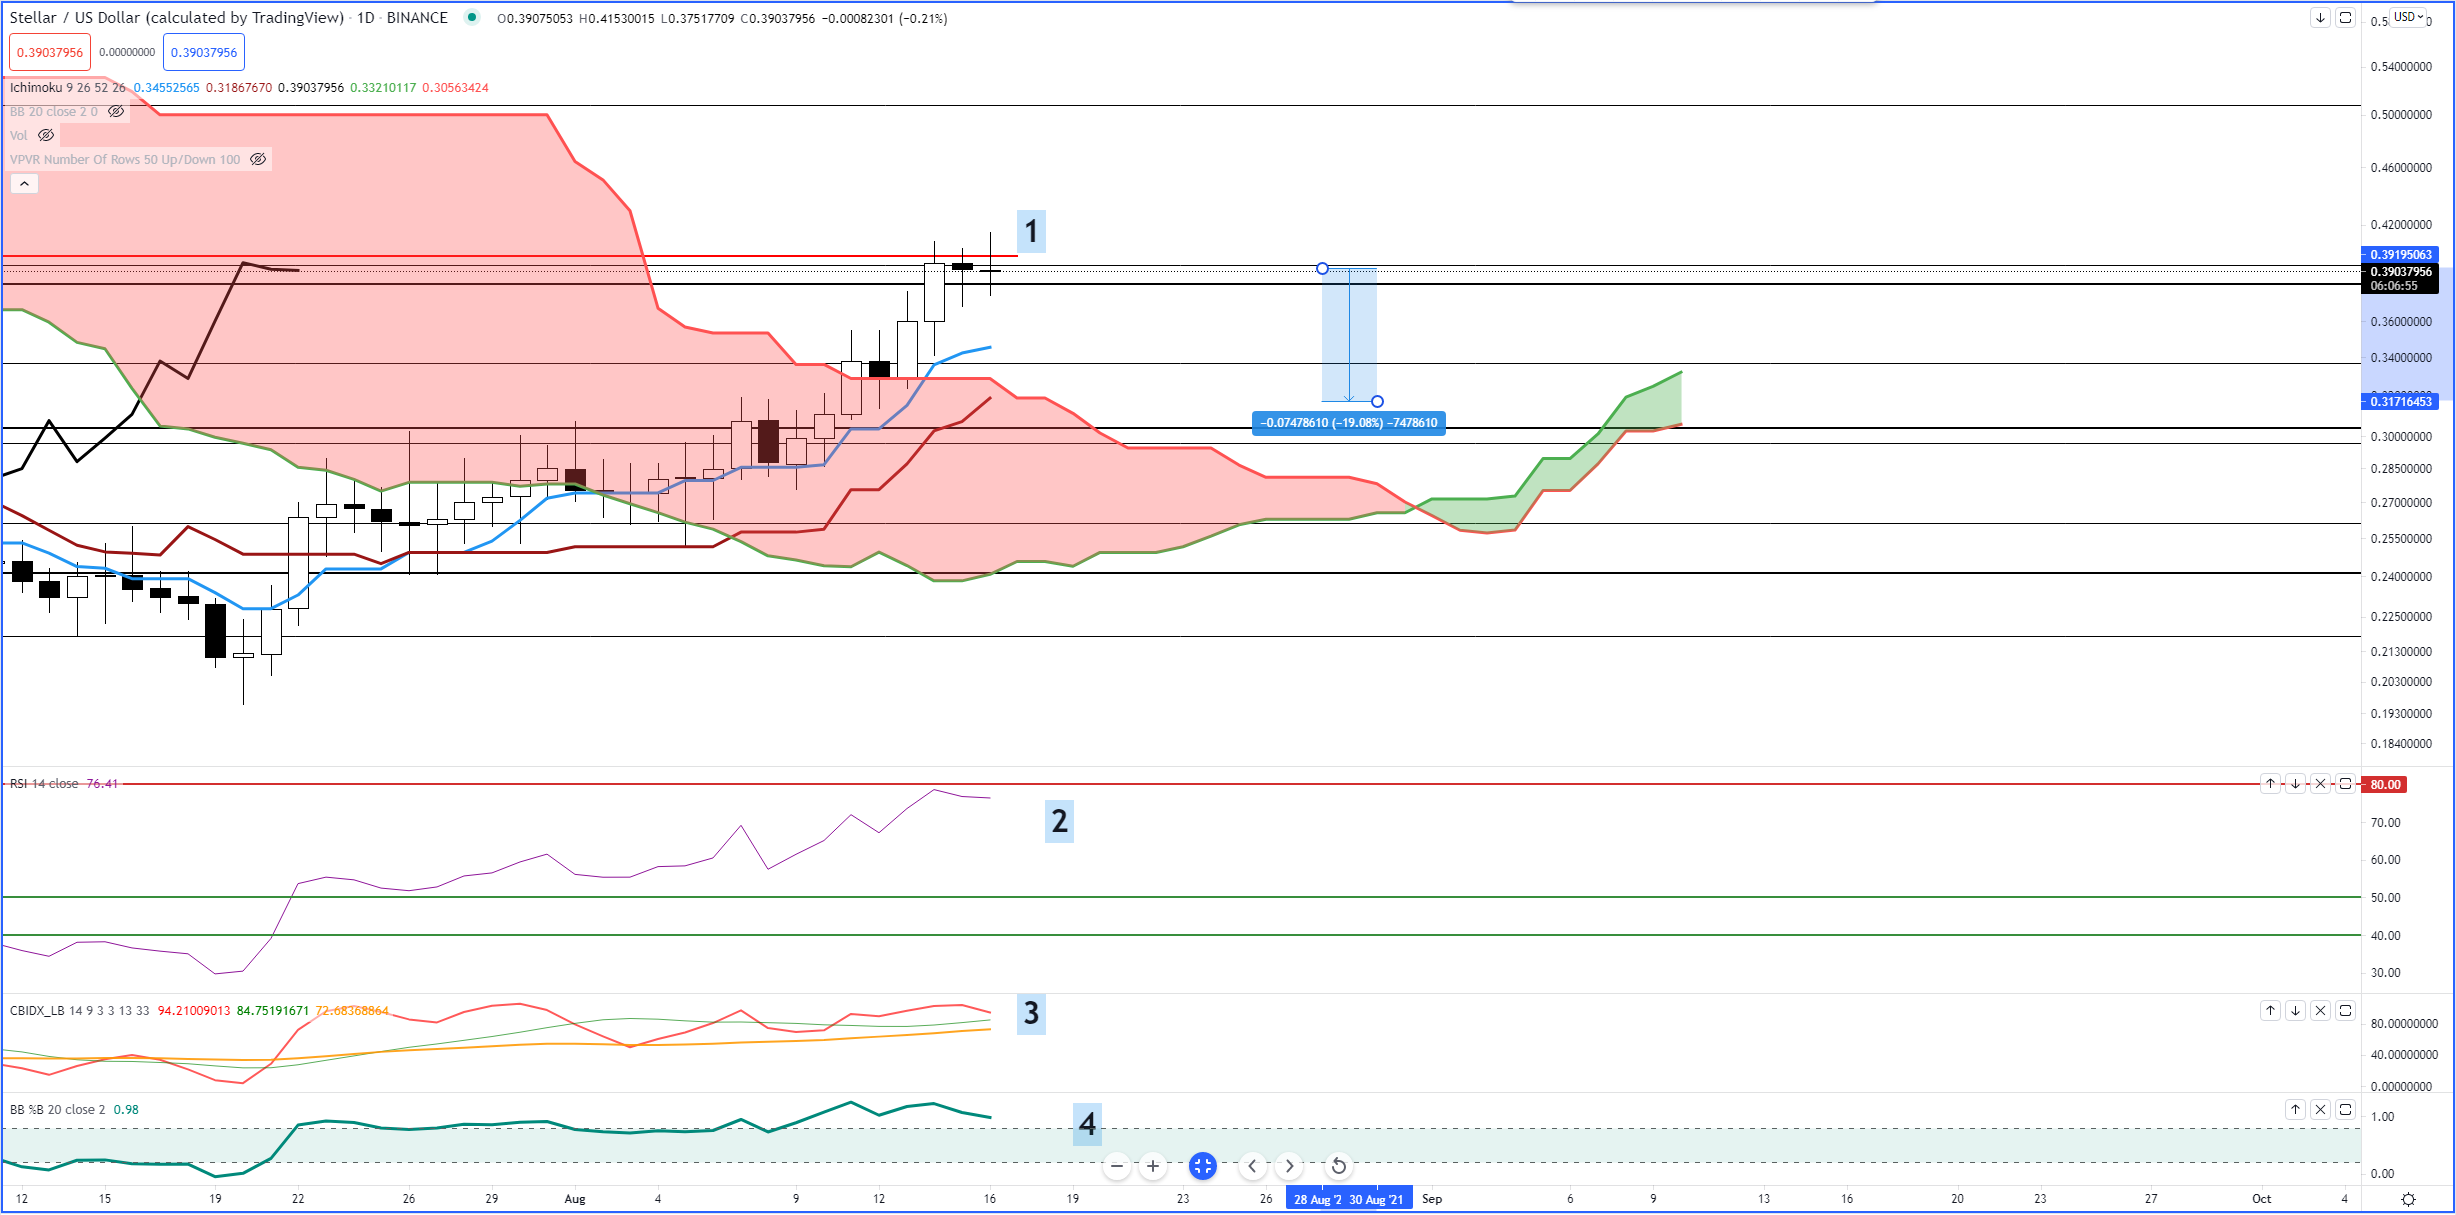
Above: Stellar (XLMUSD)
 Stellar is currently up against some strong resistance (#1). At the time of writing this article, Stellar is trading at $0.3892. The 38.2% Fibonacci Retracaement is at $0.3822 and the 2021 Volume Point Of Control (VPOC) is at $0.4008. The %B (#4) is approaching the 0.8 level and may cross below that value, creating a less volatile and more sideways market. The Composite Index (#3) has a slope that suggests it could easily drop below both the fast and slow moving averages – generating a powerful sell warning. Finally, the RSI (#2) got close the first overbought condition at 80, but was promptly rejected from moving higher. However – the RSI has technically not entered overbought territory. It is entirely likely that the congestion seen against the 2021 VPOC is just a primer to a massive blowoff-top move for Stellar. The 2021 Volume Profile things out considerably above the $0.40 – $0.41 levels. But if a pull back were to occur, then there is some significant support below. Between the $0.31 and $0.34 value areas, the daily Tenkan-Sen, Kijun-Sen, and Senkou Span B reside. The weekly Senkou Span A and Senkou Span B also reside between the $0.31 and $0.34 value areas. A price zone with a collection of those three Ichimoku levels creates one of the strongest support zones you will ever see on an Ichimoku chart. If Stellar were to drop into that support zone, it would be at a 16% to 20% discount to the current traded price.
Advertisement
Save money on your currency transfers with TorFX, voted International Money Transfer Provider of the Year 2016 – 2020. Their goal is to connect clients with ultra competitive exchange rates and a uniquely dedicated service whether they choose to trade online or over the telephone.
Find out more here.
 Bitcoin
  Ethereum
  Tether
  BNB
BNB  USDC
USDC  XRP
XRP  Solana
  TRON
TRON  Figure Heloc
  Hyperliquid