

XRP Trades Near Key Long-Term Levels as Macro Chart Maps Path Toward $8.
XRP is trading around $1.49, down about 5.1% over the past 24 hours, according to CoinMarketCap. The token has traded between approximately $1.49 and $1.65 during the period, with a market capitalization of about $93.6 billion and 24-hour volume of roughly $8.42 billion.
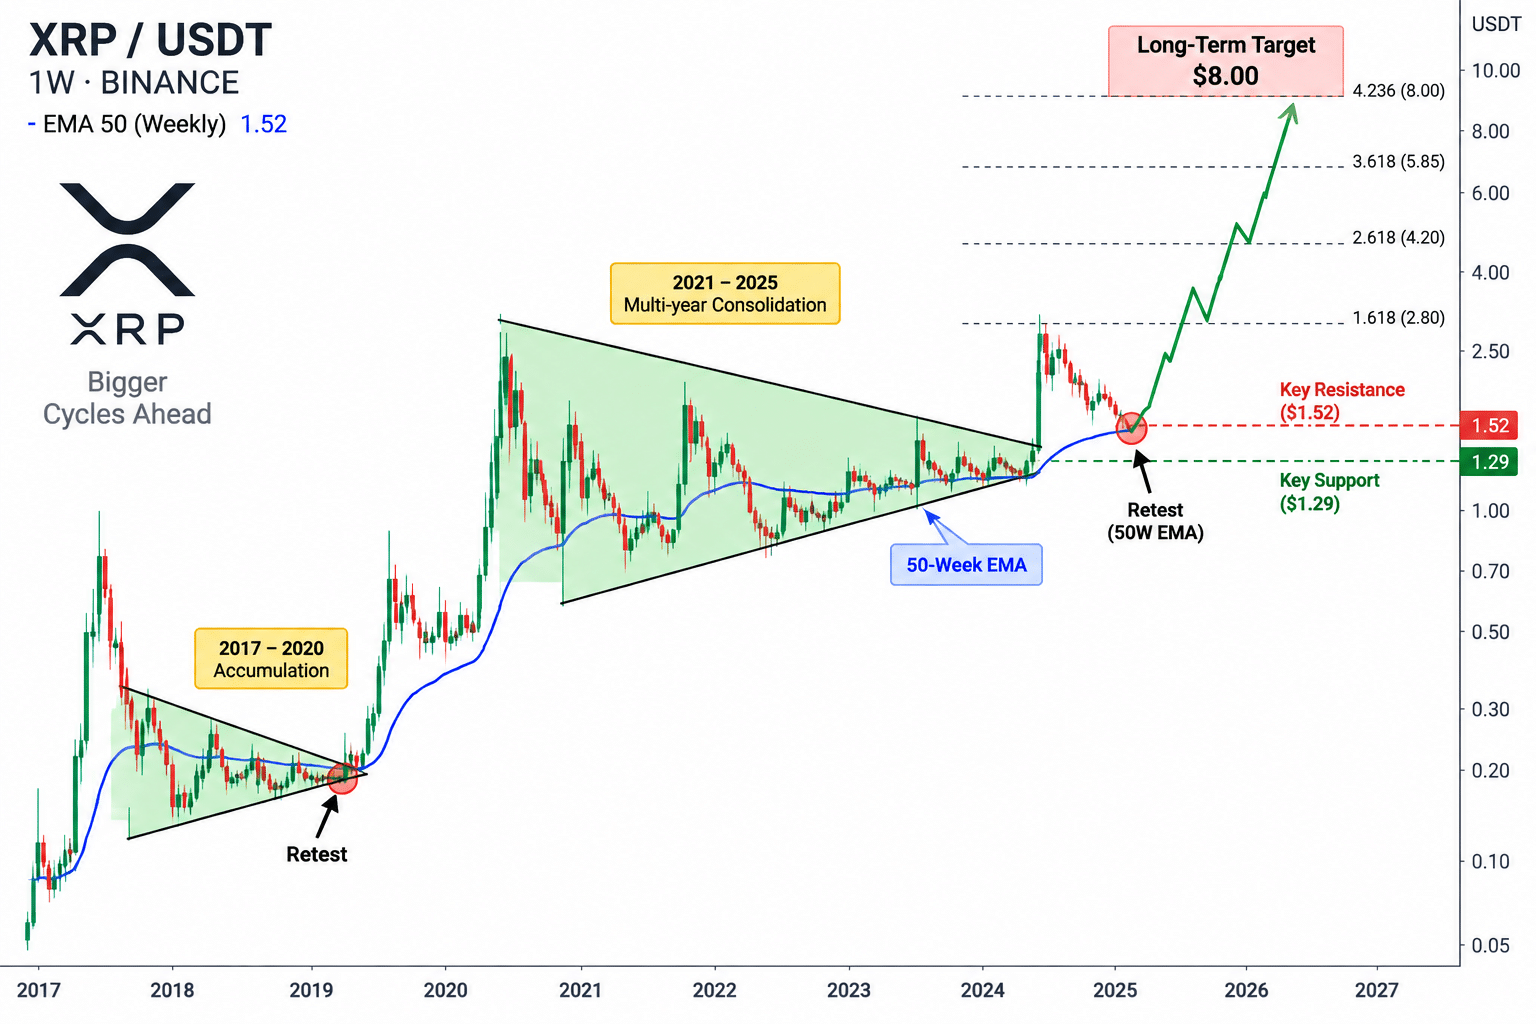
The latest price action places XRP back around a technical region highlighted in the long-term chart. The structure focuses on multi-year consolidation, repeated compression patterns, Fibonacci-derived levels, and the 50-week exponential moving average (EMA).
Long-Term XRP Structure
The chart compares two large consolidation structures. In the earlier cycle, XRP spent an extended period compressing inside converging support and resistance before breaking higher. After the breakout, price returned toward the former compression boundary for a retest, followed by a substantial upward expansion.
The larger structure shown on the right follows a similar sequence on a much longer timeframe. XRP formed another broad contracting formation, subsequently moved outside that structure, and is now shown in the chart’s retest phase.
This is the central point of the chart: the current pullback is occurring after the larger multi-year compression was broken, rather than while XRP remains inside that original structure.
50-Week EMA Is the Central Technical Test
The most important feature in this XRP chart is the 50-week exponential moving average (50W EMA). The chart presents the current market structure as a battle around this long-term trend measure after XRP’s 2026 decline.
An EMA gives greater weight to recent prices than a simple moving average. On a weekly chart, the 50W EMA therefore represents roughly one year of price history while responding more quickly to recent changes. In this chart, it separates the current recovery/retest from a confirmed return to the larger upward structure.
$1.29, $1.52 and the 50-Week EMA
The analysis identifies approximately $1.29 as an important support region and around $1.52 as a significant resistance area, alongside the ongoing test of the 50-week EMA.
With XRP currently around $1.49, price is only about 2% below $1.52 and roughly 15.5% above $1.29.
The chart describes 2026 as the convergence period for these long-term technical structures. Its projected path shows XRP completing the retest before moving toward a group of higher horizontal Fibonacci-extension levels.
Fibonacci Levels Map the Longer-Term XRP Targets
The chart also uses Fibonacci extension levels to map the projected price zones above the current structure. The first major extension shown is the 1.618 level near $2.80, followed by the 2.618 extension around $4.20 and the 3.618 level near $5.85. The upper 4.236 extension corresponds to approximately $8.00, which forms the chart’s longer-term projected target.
These Fibonacci levels sit above the immediate $1.52 resistance and 50-week EMA area. Therefore, the chart’s sequence is structured as 50-week EMA/$1.52 test → $2.80 → $4.20 → $5.85 → $8.00. The higher Fibonacci levels are projected technical levels rather than prices XRP has already reached in the current move.
From the current CoinMarketCap price of approximately $1.49, reaching $8 would represent a gain of about 437%, equivalent to approximately 5.37 times the current price.
The $8 level is a technical projection shown by the macro chart, not completed price action. At present, the measurable structure consists of XRP trading near $1.49, while the chart’s previously identified $1.29 support, $1.52 resistance, and 50-week EMA remain the immediate long-term reference points.
 Bitcoin
  Ethereum
  Tether
  BNB
BNB  XRP
XRP  USDC
USDC  Solana
  TRON
TRON  Zcash
Zcash  Figure Heloc