

XRP Breaks $1.56 After 27.6% Rally as Inverse Head-and-Shoulders Pattern Nears Confirmation.
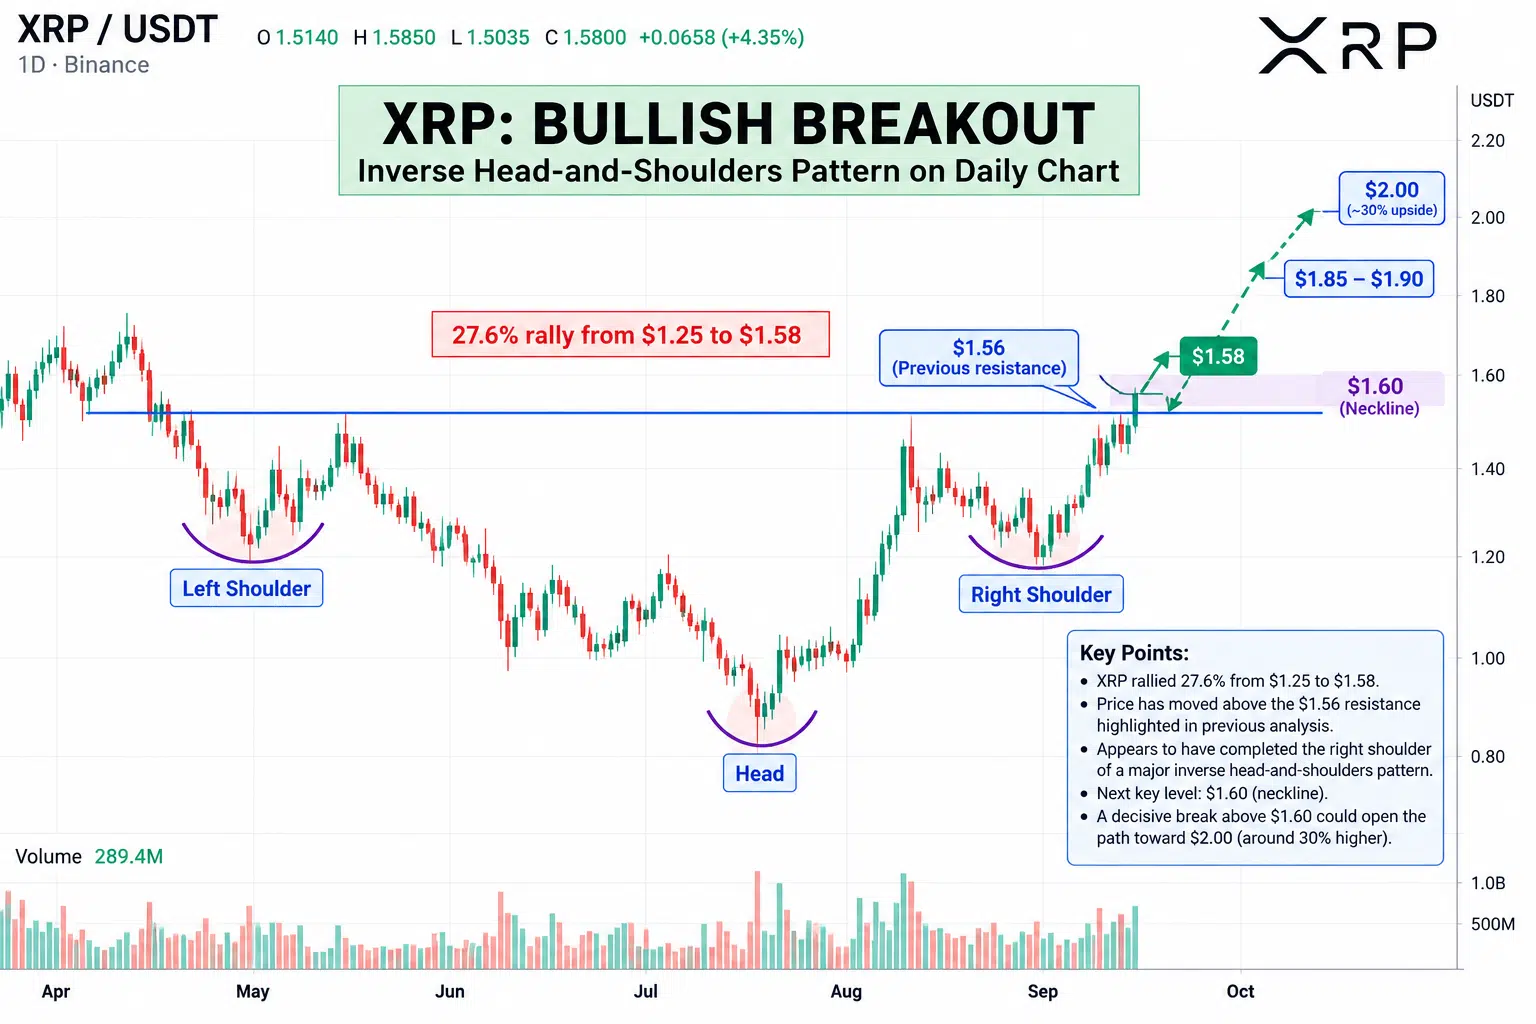
XRP has moved through the $1.56 resistance level highlighted in our previous technical coverage, with the latest daily chart showing price around $1.58 following a 27.6% advance from approximately $1.25.
The move places XRP directly around the neckline of a large inverse head-and-shoulders formation visible on the daily timeframe. The chart identifies a left shoulder during the April-May period, a head around the August low near $1.00, and a right shoulder formed during the September pullback.
XRP Moves Above Previously Tested $1.56 Level
In our previous report, XRP was trading near $1.54 and approaching approximately $1.56 for the fifth time in 2026. Four earlier attempts had failed to produce a sustained move through that area.
The latest chart shows XRP reaching approximately $1.58, placing price above $1.56 on an intraday basis.
$1.25 was the starting point of the right shoulder; the move to $1.58 represents an increase of roughly 26.4%; the cited 27.6% rally may reflect different intraday endpoints.
The next nearby area highlighted by the new chart is around $1.60, which also corresponds closely with the neckline of the inverse head-and-shoulders formation.
Chart Maps Potential Move Toward $2
The technical projection accompanying the chart places approximately $2.00 as the measured upside objective if XRP establishes a breakout above the neckline.
From $1.58, reaching $2 would represent an additional increase of approximately 26.6%. From a $1.60 breakout reference, the move to $2 equals 25%.
The projected path on the chart first moves through $1.60, consolidates around the $1.60–$1.65 region, and then extends toward approximately $1.85–$1.90 before reaching $2. That path is a chart projection rather than completed price action.
The current chart therefore places XRP at the intersection of three previously identified levels: the repeatedly tested $1.56 resistance, the inverse head-and-shoulders neckline around $1.60, and the large historical supply concentration around the same $1.60 region.
 Bitcoin
  Ethereum
  Tether
  BNB
BNB  XRP
XRP  USDC
USDC  Solana
  TRON
TRON  Figure Heloc
  Zcash
Zcash 