

Polygon’s (MATIC) upward movement culminated on Oct 28 with an increase of 28% in a single day. While a short-term drop could occur, the token is likely to make a run at the all-time highs soon.
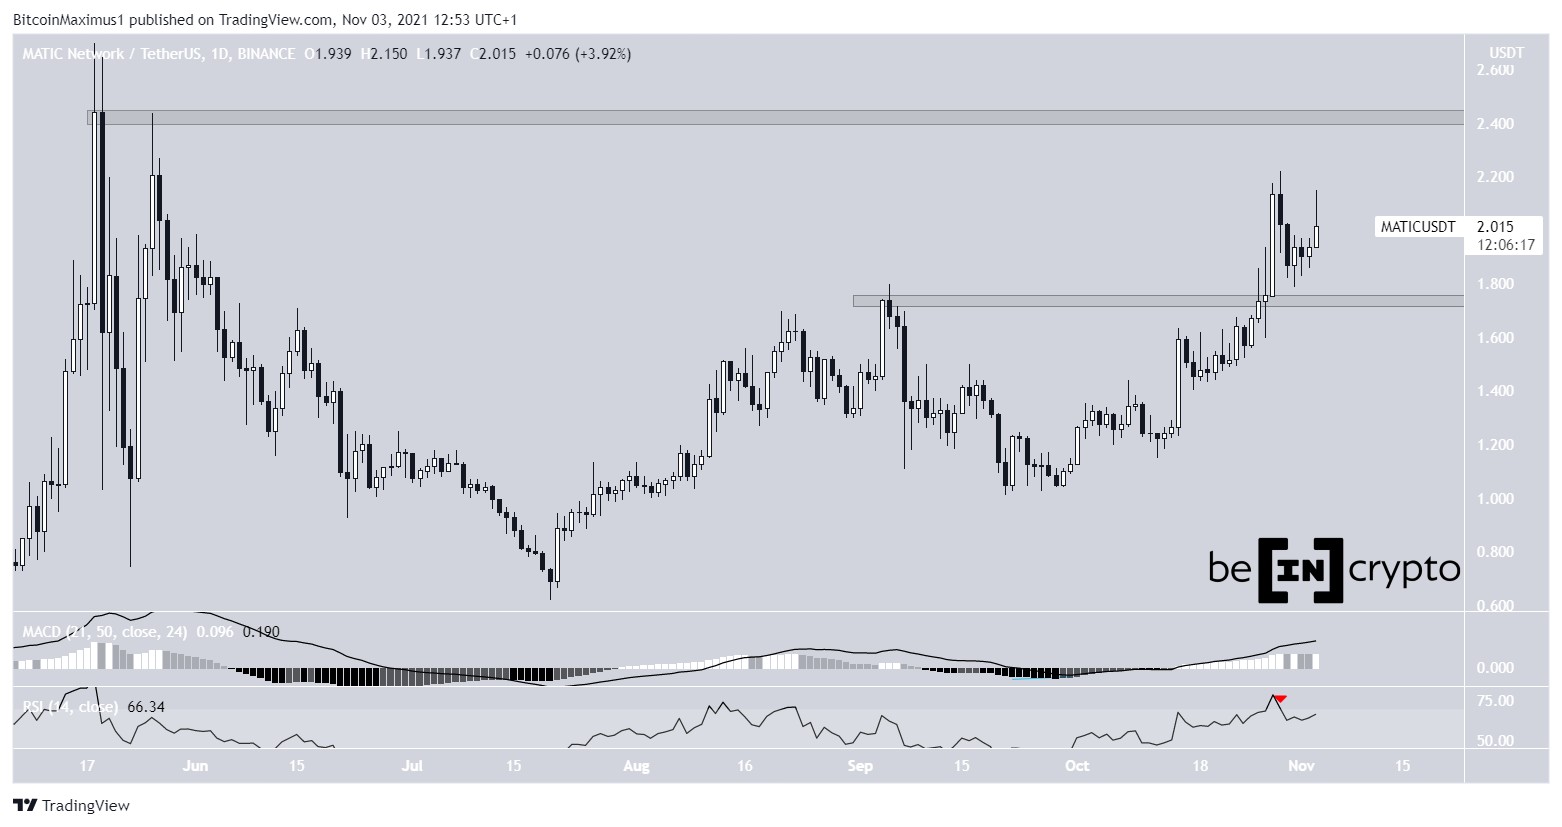
MATIC has been increasing since Sept 21. On Oct 27, it broke out above the $1.74 resistance area and increased significantly the next day.
The breakout was important since the token finally moved above its Sept highs after a decrease that had been ongoing since Sept 5. The next resistance area is at $2.42, close to the all-time high price.
Despite the breakout, technical indicators are still mixed. The MACD, which is created by a short- and a long-term moving average (MA), is still moving upwards. This means that the short-term trend is still faster than the long-term lone. However, the RSI, which is a momentum indicator, has fallen below 70 (red icon). This is a sign of decreasing momentum.
In addition to this, MATIC has not yet validated the $1.74 area as support. After breaking out, the price usually re-tests the breakout level prior to resuming its upward movement.
Therefore, it is possible that MATIC will do so prior to initiating another upward movement.
Future movement
Cryptocurrency trader @Altcoinsherpa tweeted a MATIC chart, stating that the token will soon break out from the $1.70 resistance area.

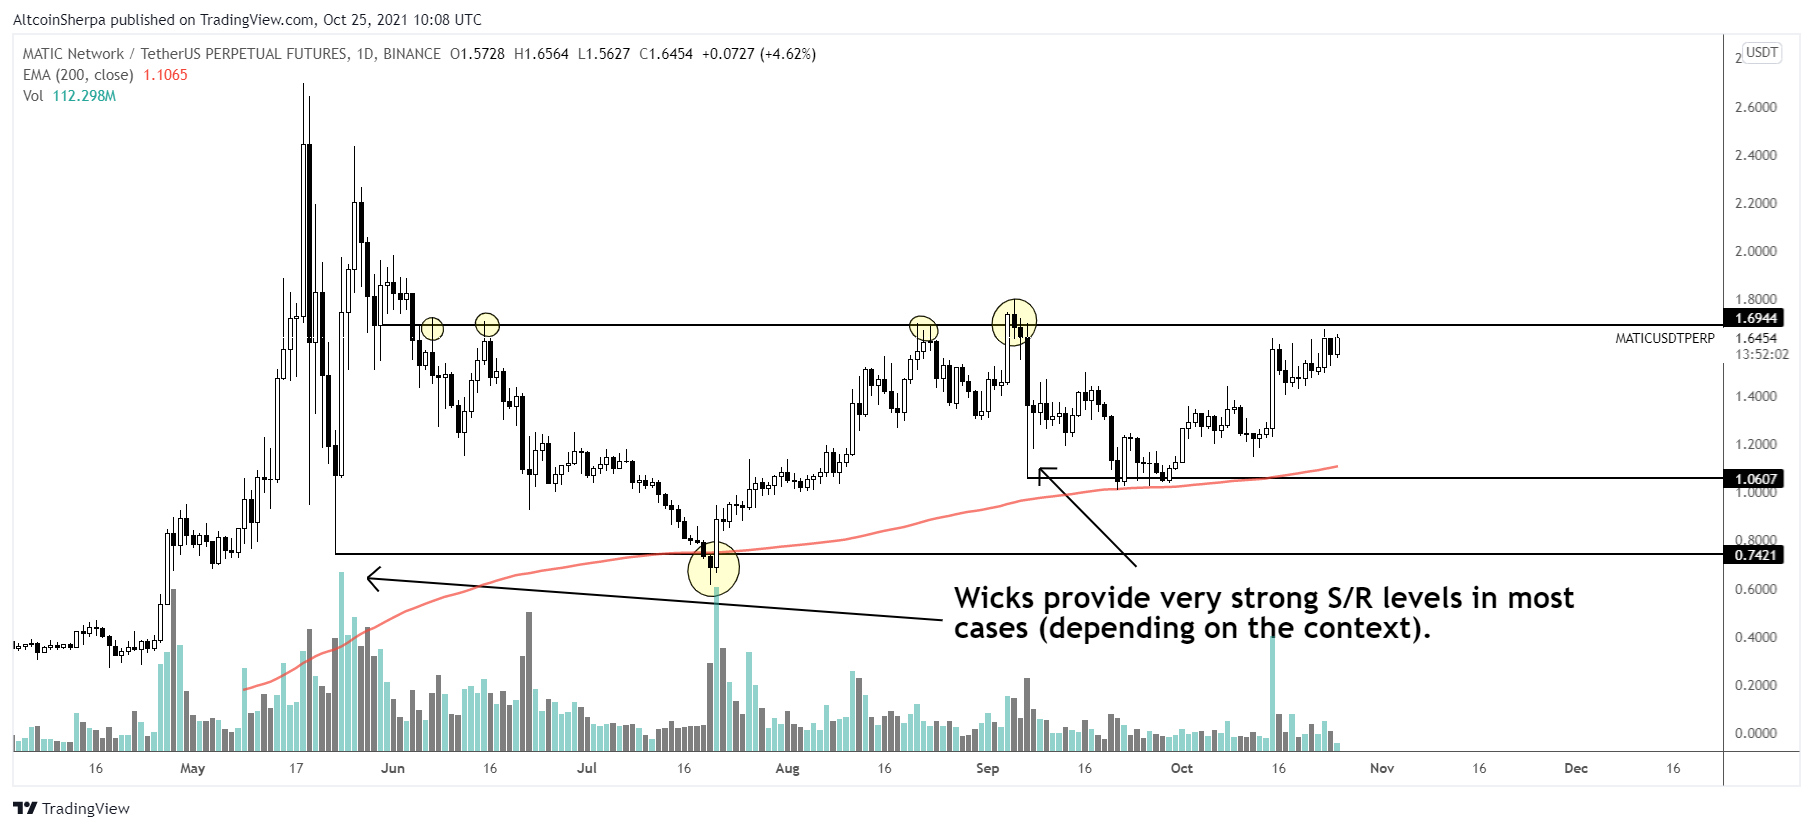
Since the tweet, MATIC has broken out, as evidenced in the previous section.
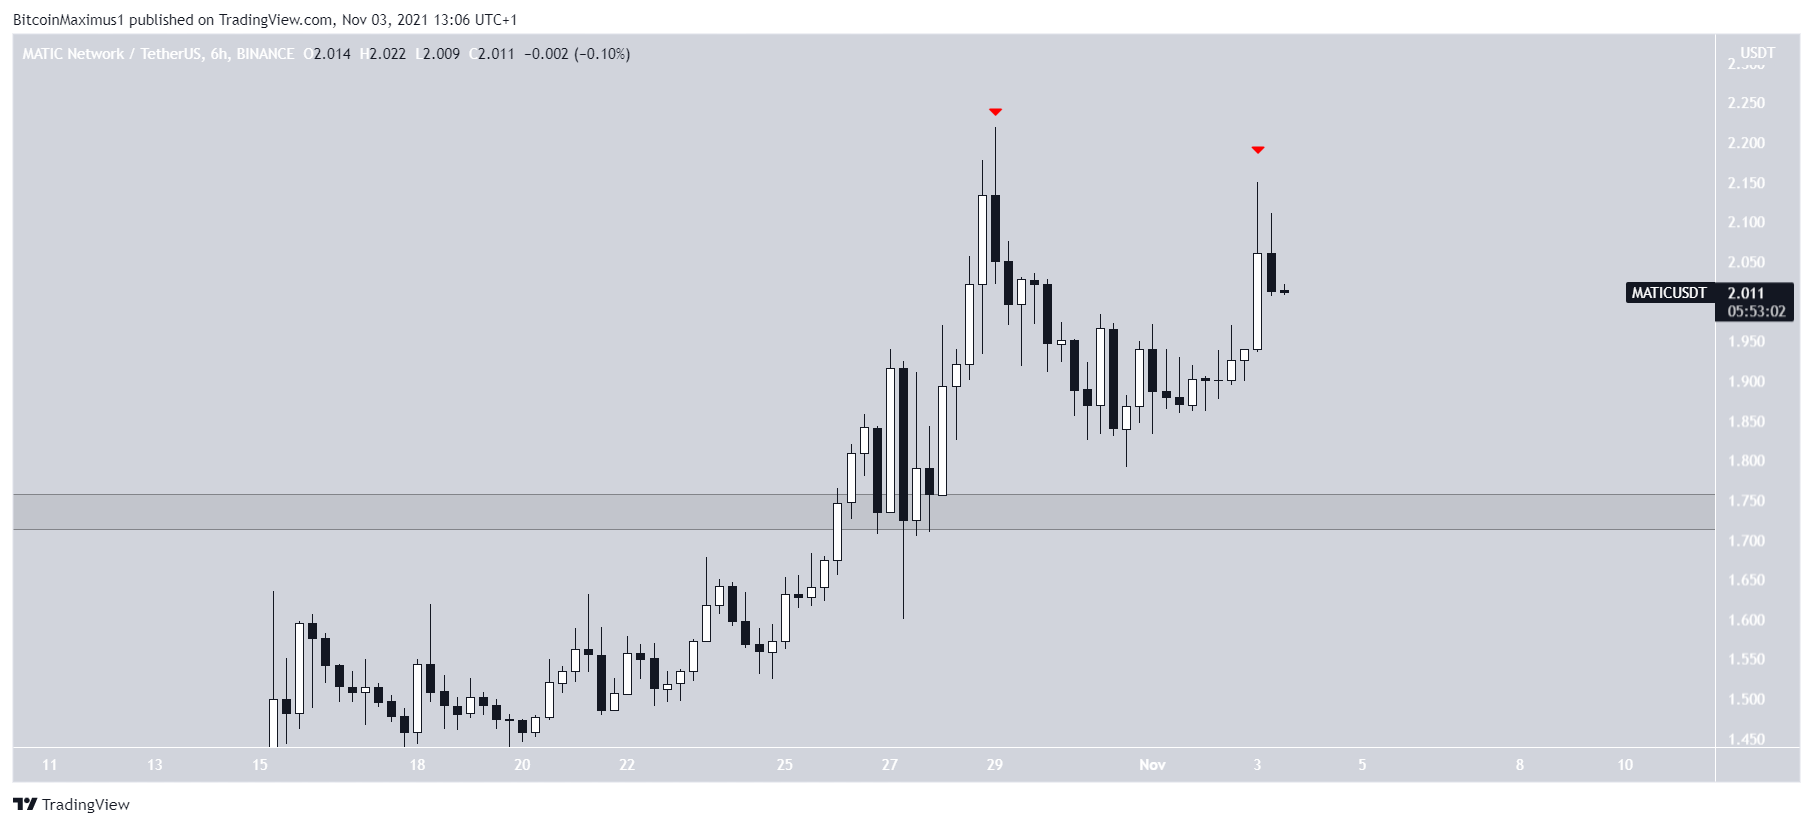
However, it has created a lower high in the short-term (red icon). This is a bearish sign, since it shows that the second attempt at initiating an upward movement was weaker than the first one.
Furthermore, the presence of long upper wicks is also a sign of selling pressure.
Therefore, it is possible that MATIC will drop to the $1.74 area once more prior to resuming its upward movement.

MATIC/BTC
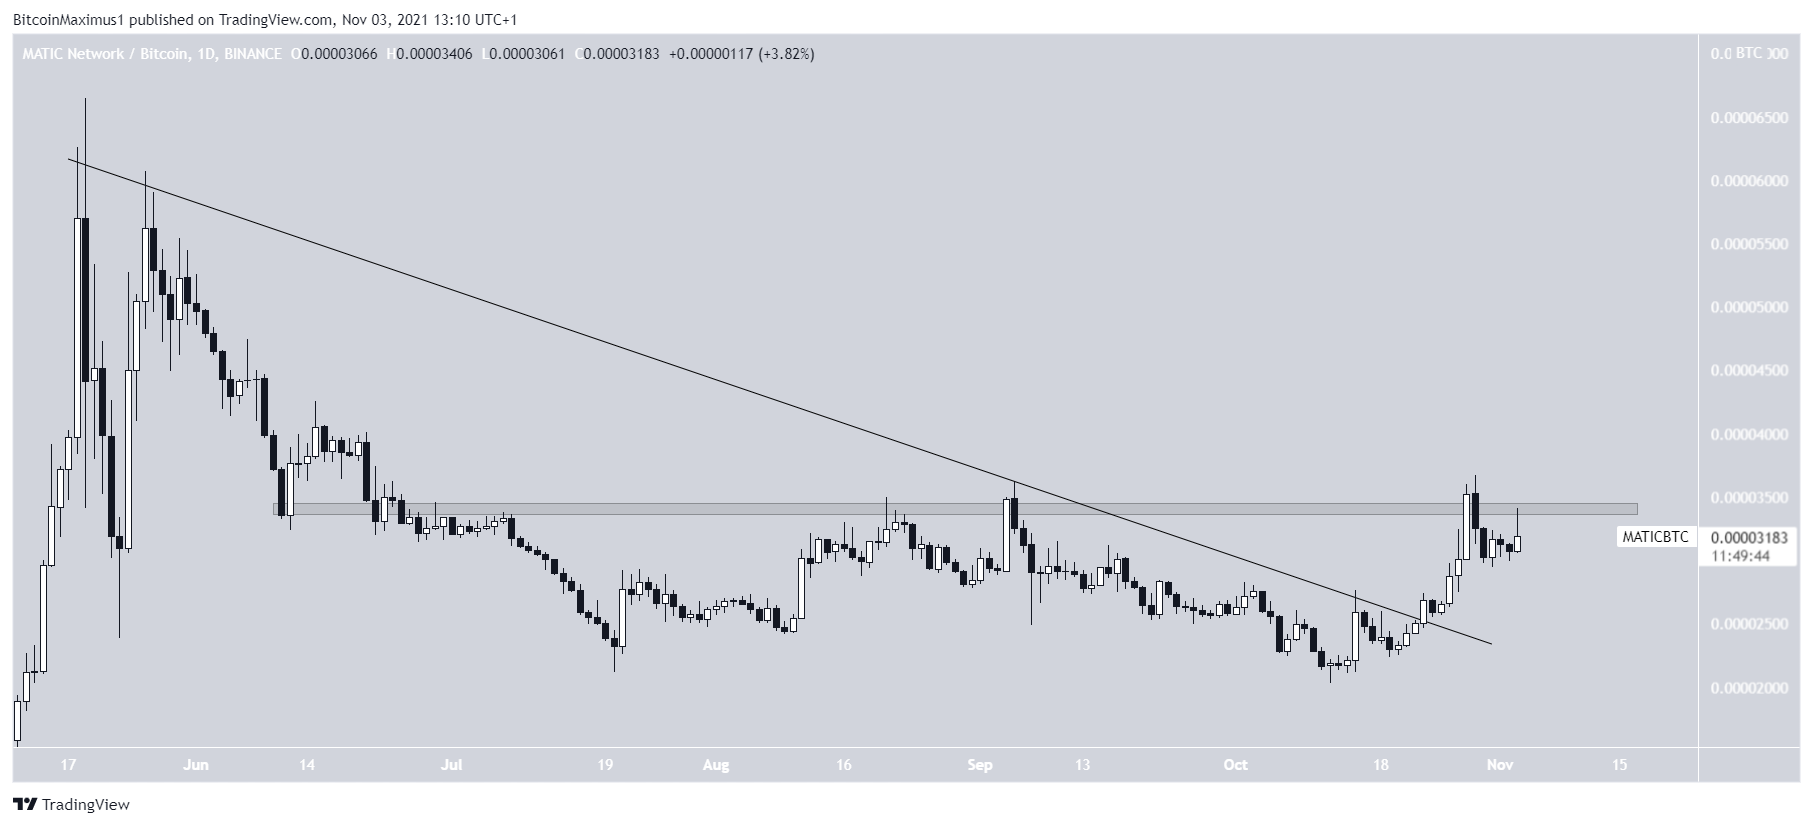
The MATIC/BTC pair is not as bullish as its USD counterpart. Since the token is facing resistance at 3,450 satoshis.
However, it has also broken out from a descending resistance line in place since the May all-time high. This is a sign that the long-term correction is complete, despite the resistance from the 3,450 satoshi area.
Therefore, while a short-term decrease could occur, the most likely scenario would have MATIC/BTC eventually breaking out from the 3,450 satoshi area.
This would also align with the MATIC/USD movement, in which a short-term decrease could also transpire.
For BeInCrypto’s latest Bitcoin (BTC) analysis, click here.
Disclaimer
All the information contained on our website is published in good faith and for general information purposes only. Any action the reader takes upon the information found on our website is strictly at their own risk.
 Bitcoin
  Ethereum
  Tether
  BNB
BNB  USDC
USDC  XRP
XRP  Solana
  TRON
TRON  Figure Heloc
  Hyperliquid