

Bitcoin (BTC) has bounced after creating a double bottom pattern.
Ethereum (ETH) has bounced at the $1,750 horizontal support area.
XRP (XRP) has created a double bottom pattern but has yet to initiate an upward move.
DFI.Money (YFII) has reclaimed the $2,120 area and validated it as support.
Decred (DCR) has created a triple bottom pattern.
Polygon (MATIC) is following a descending resistance line.
THORChain (RUNE) has bounced at the $3.80 horizontal support area.
BTC
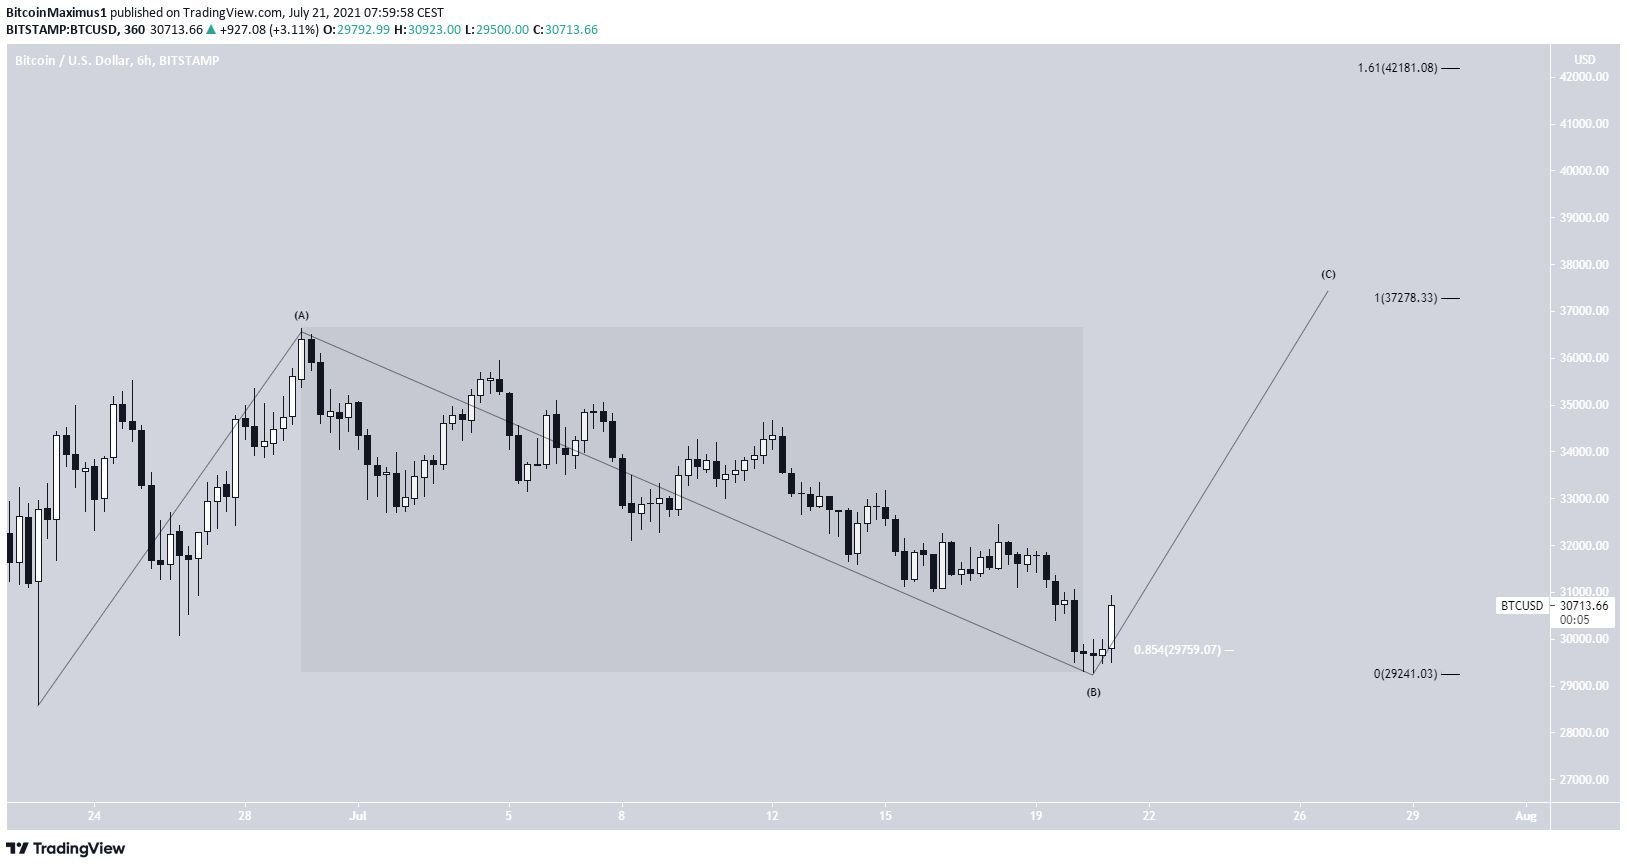
BTC reached a low of $29,296 on July 20 but bounced shortly after. It’s likely that the movement is an A-B-C flat corrective structure. If so, BTC is currently in the C wave.
The preceding decrease does not look like a bearish impulse due to there being gradual and choppy downward movement. Therefore, it’s likely that it is a corrective structure.
The two most likely targets for the top of the upward movement are at $37,278 and $42,181. The former gives waves A:C a 1:1 ratio while the latter gives them a 1:1.61 ratio.
The wave count would be invalidated with a decrease below the $29,279 low reached on July 20.
For a more detailed analysis of the wave count, click here.
ETH
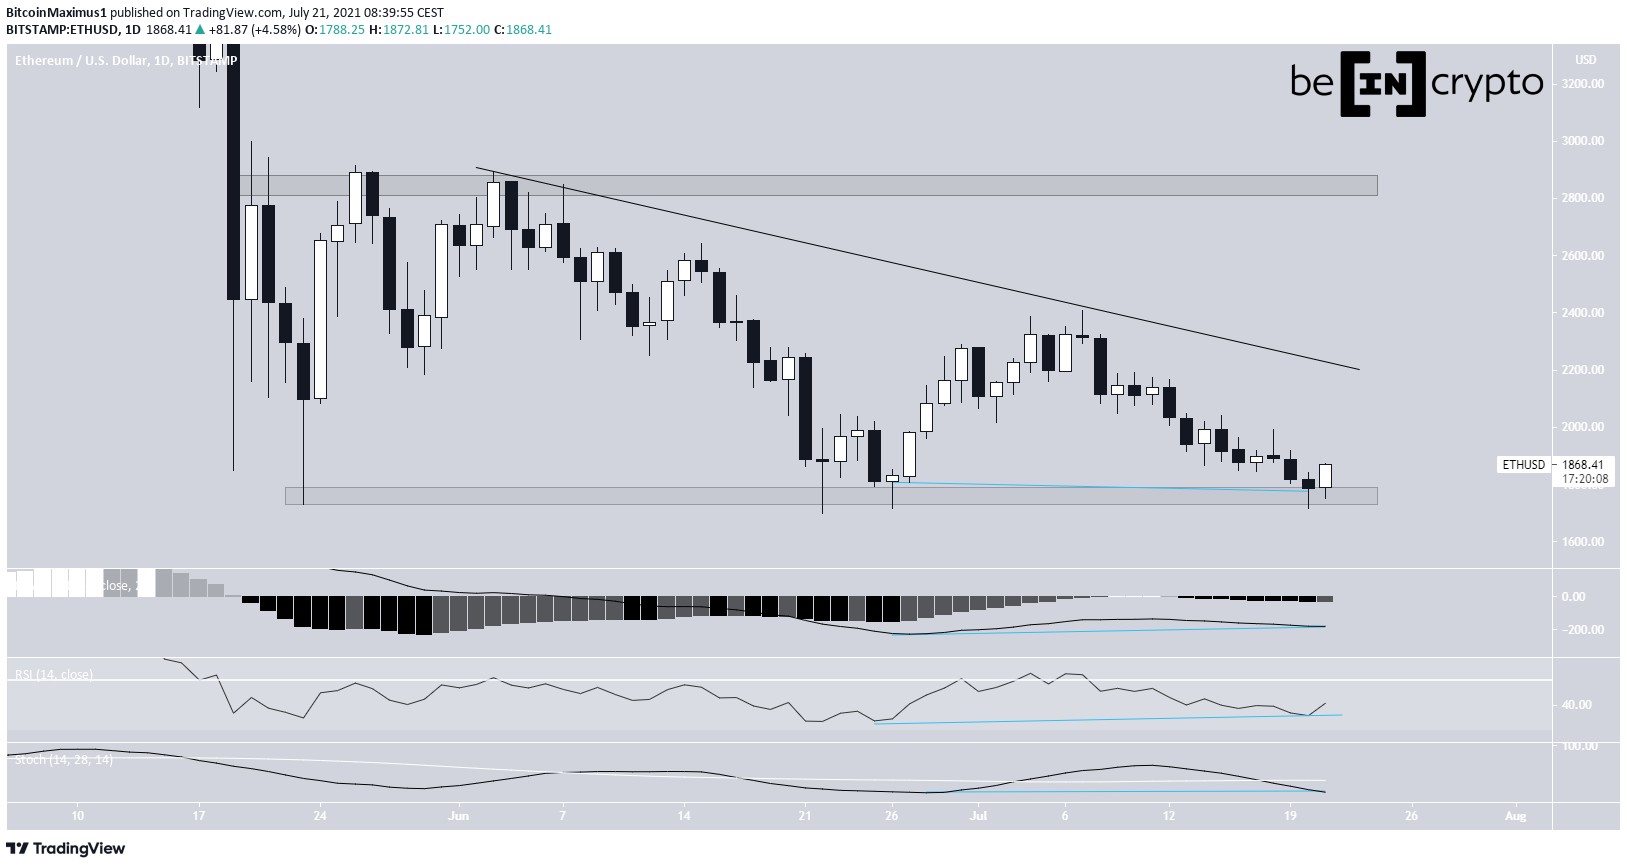
ETH has been decreasing alongside a descending resistance line since June 2. On June 22 and 26, it reached lows near $1,720 and bounced, creating two long lower wicks.
However, it was rejected by the descending resistance line shortly after and has been moving downwards since.
On July 20, it reached a low of of $1,717. The low was combined with bullish divergences in the MACD, RSI, and Stochastic oscillator.
Another bounce followed on July 21 and ETH is in the process of creating a bullish engulfing candlestick.
The descending resistance line is found at $2,200 while the next resistance area is at $2,850.

XRP
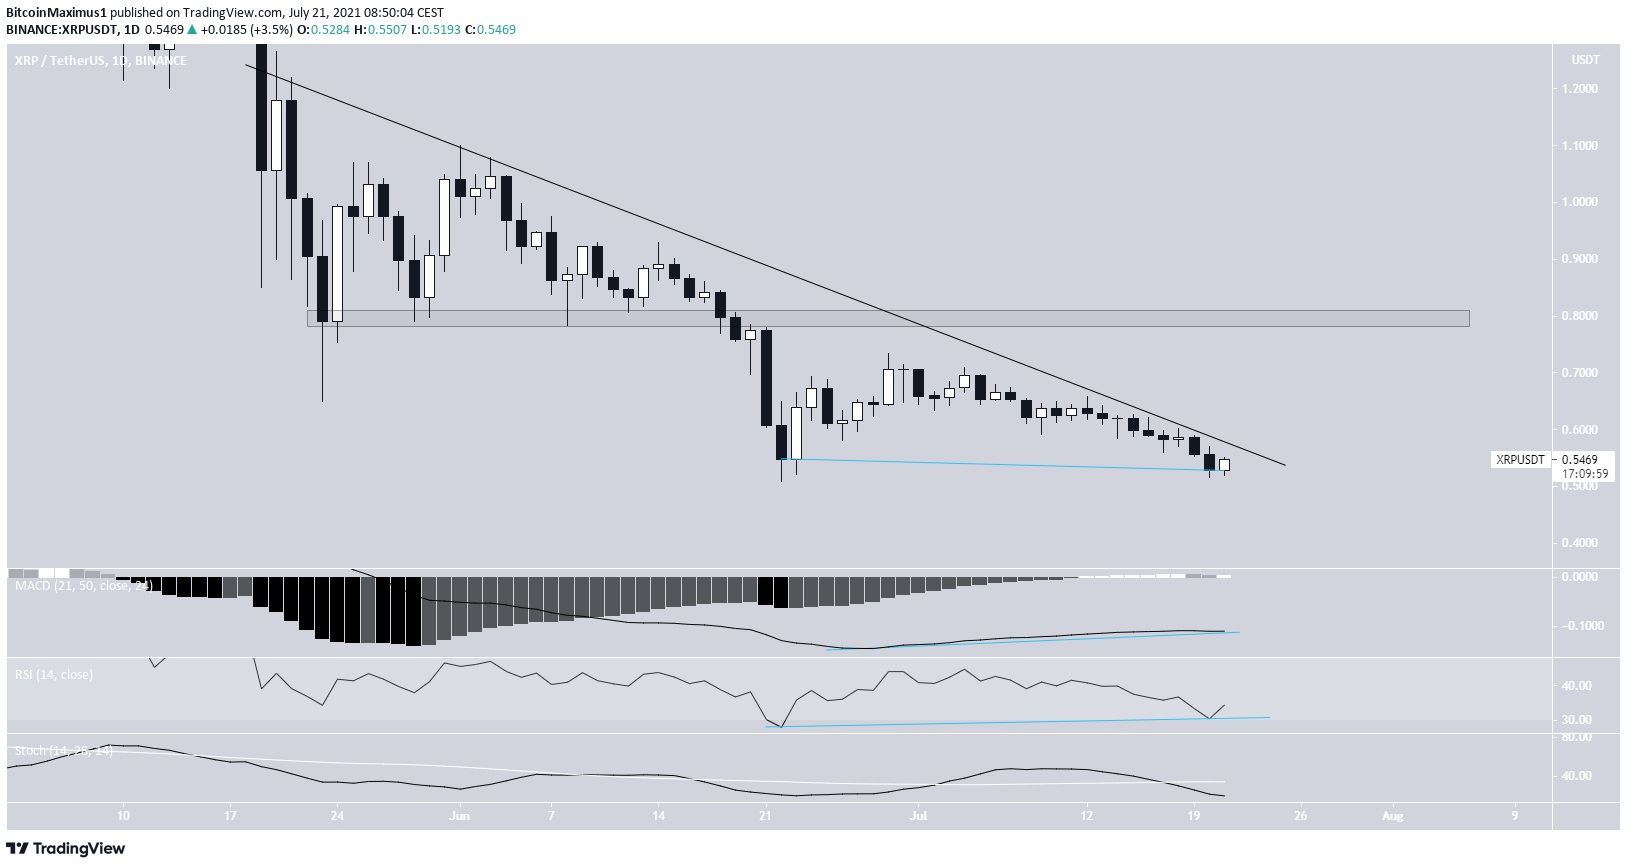
XRP has been decreasing alongside a descending resistance line since May 20. On June 22, it reached a low of $0.50 and bounced.
However, it failed to move above the descending resistance line and was rejected on July 12 once again.
On July 20, XRP reached a low of $0.515, creating a double bottom similar to that of BTC. The pattern was also combined with bullish divergences in the MACD and RSI.
However, XRP has yet to initiate an upward move. If it breaks out, the next resistance would be found at $0.80.
YFII
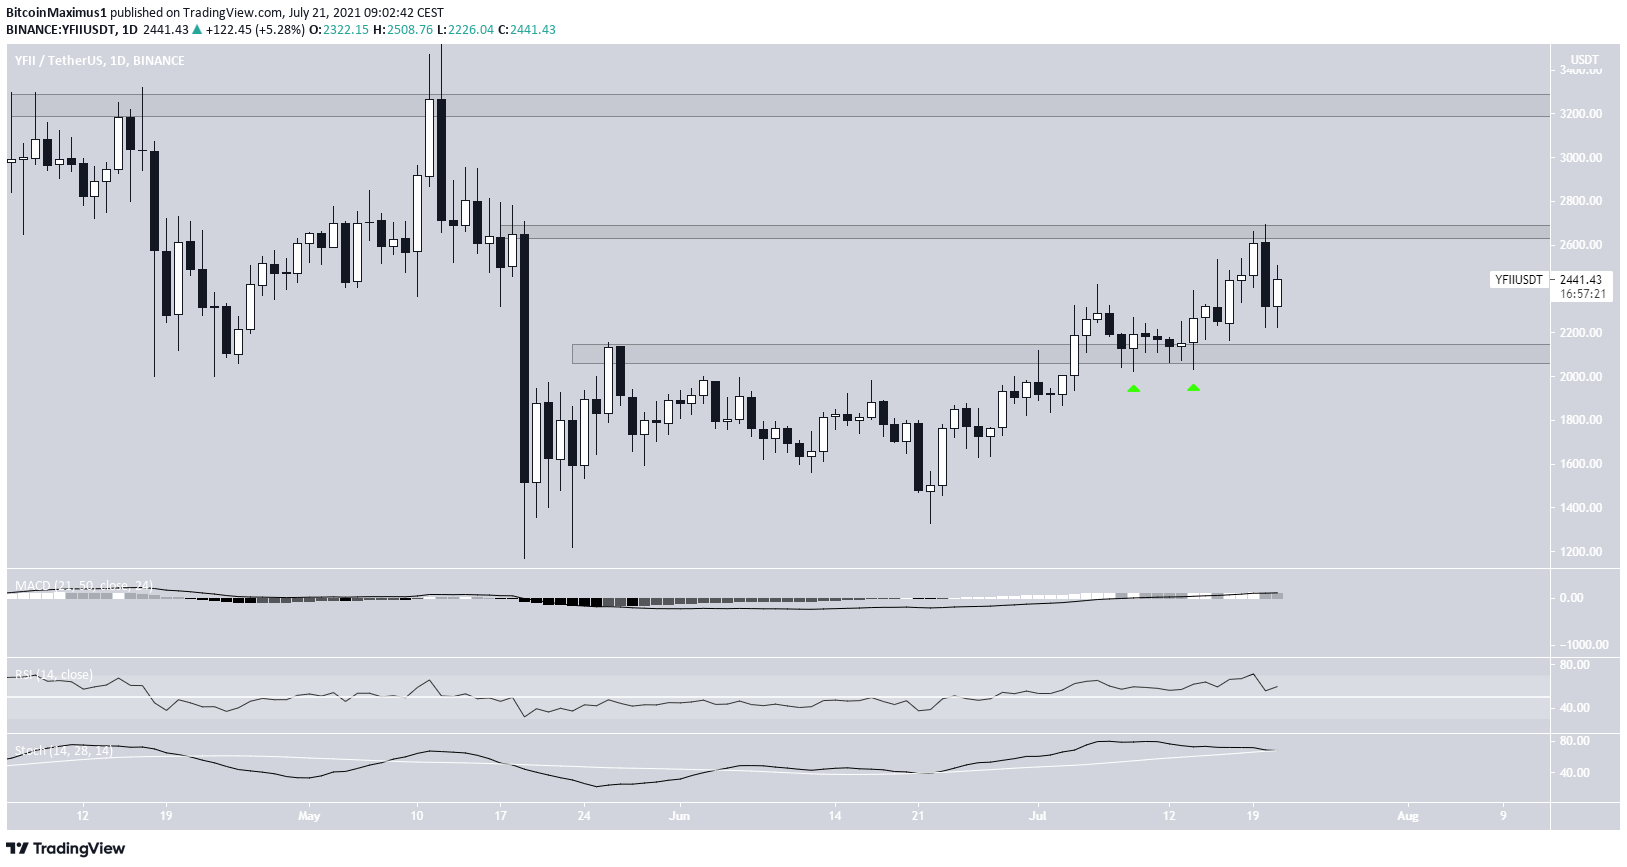
YFII has been moving upwards since May 19, and created a higher low on June 22.
On July 5, it broke out from the $2,120 resistance area and validated it as support a few days later (green icon).
Despite this, YFII was rejected by the $2,660 resistance area on July 20.
Technical indicators are still bullish, suggesting that YFII will eventually make another breakout attempt.
DCR
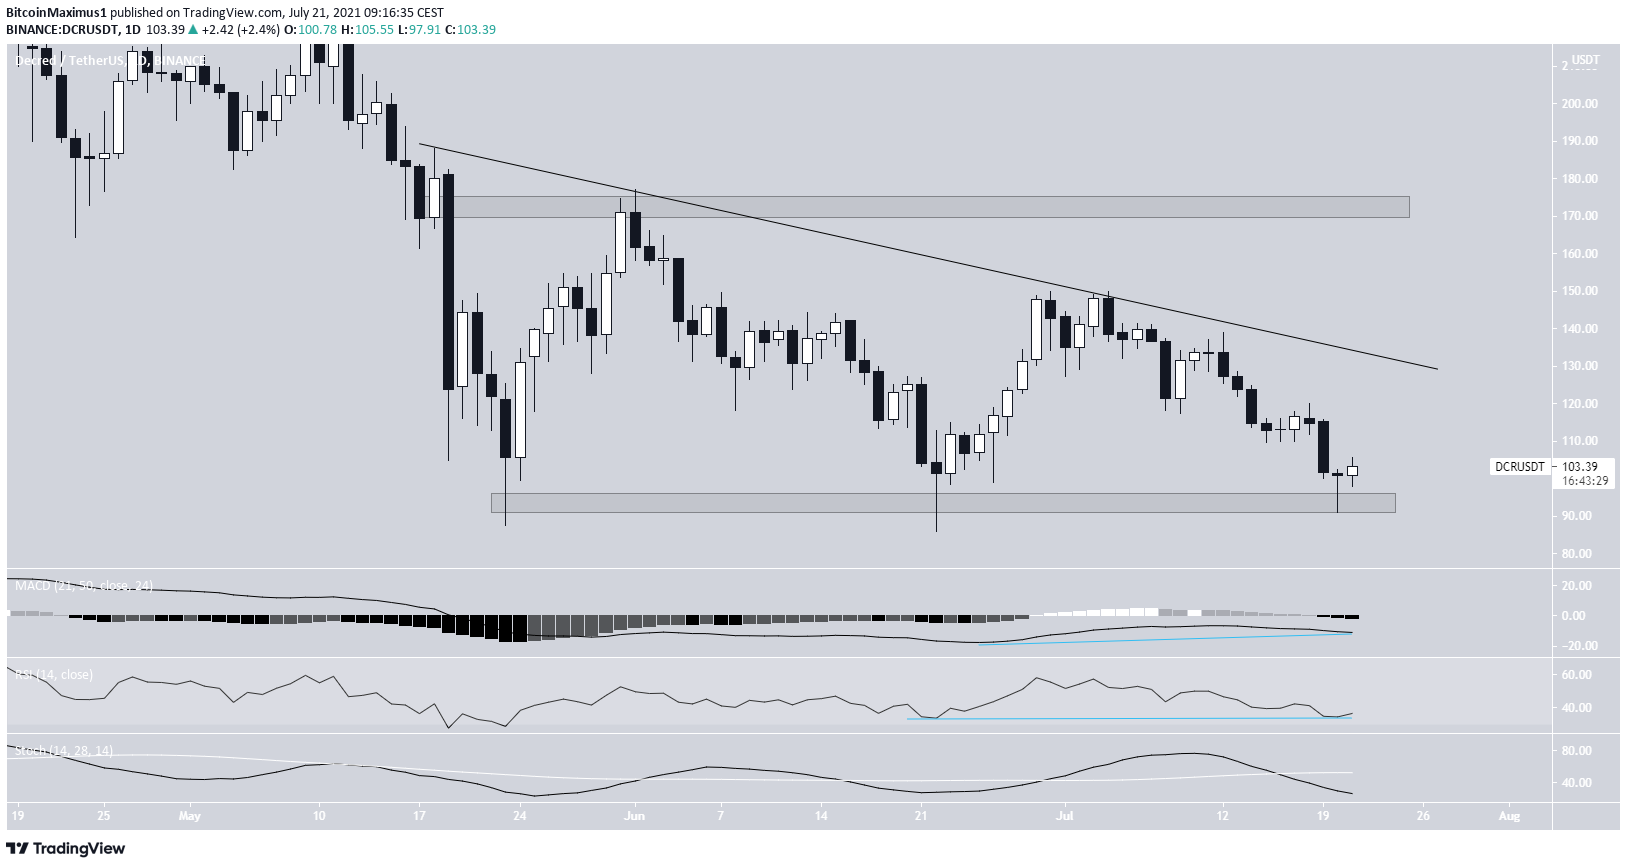
DCR has created a triple bottom pattern inside the $95 horizontal support area.
The bottoms were reached on May 23, June 22, and July 20.
In addition, the most recent two bottoms have been combined with bullish divergences in the MACD and RSI.
DCR is still following a descending resistance line which is currently at $130.
If it breaks out, the next resistance would be found at $175.
MATIC
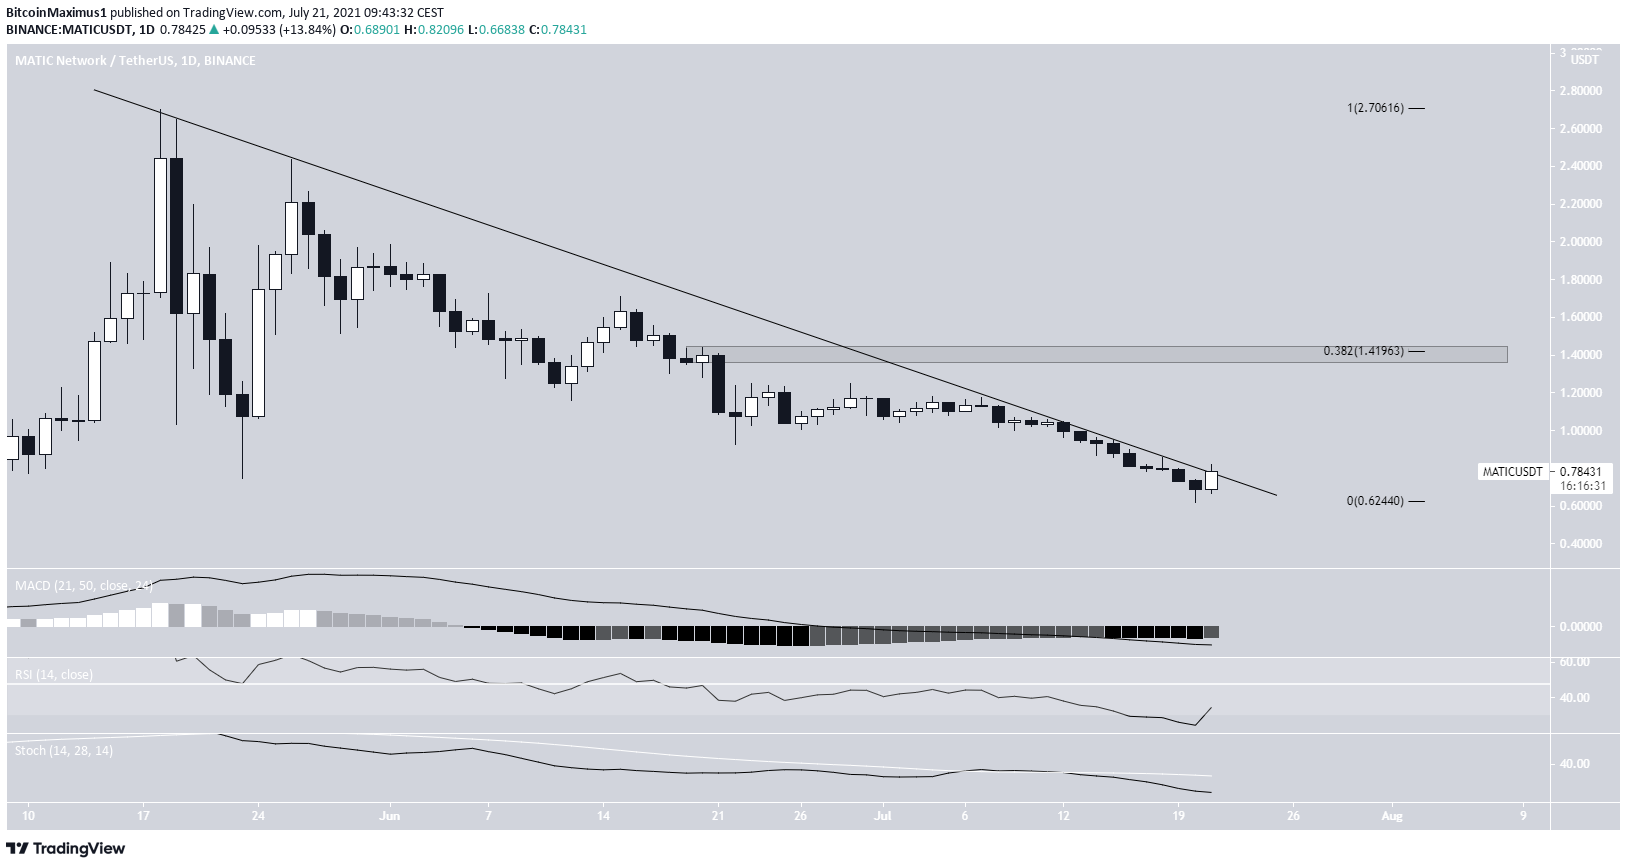
MATIC has been decreasing alongside a descending resistance line since May 18 after it reached a high of $2.70. So far, it has touched a low of $0.62 on July 20.
While technical indicators are still bearish, MATIC is in the process of breaking out from this descending resistance line.
If successful, the next resistance would be found at $1.42. This target is the 0.382 Fib retracement resistance level.
RUNE
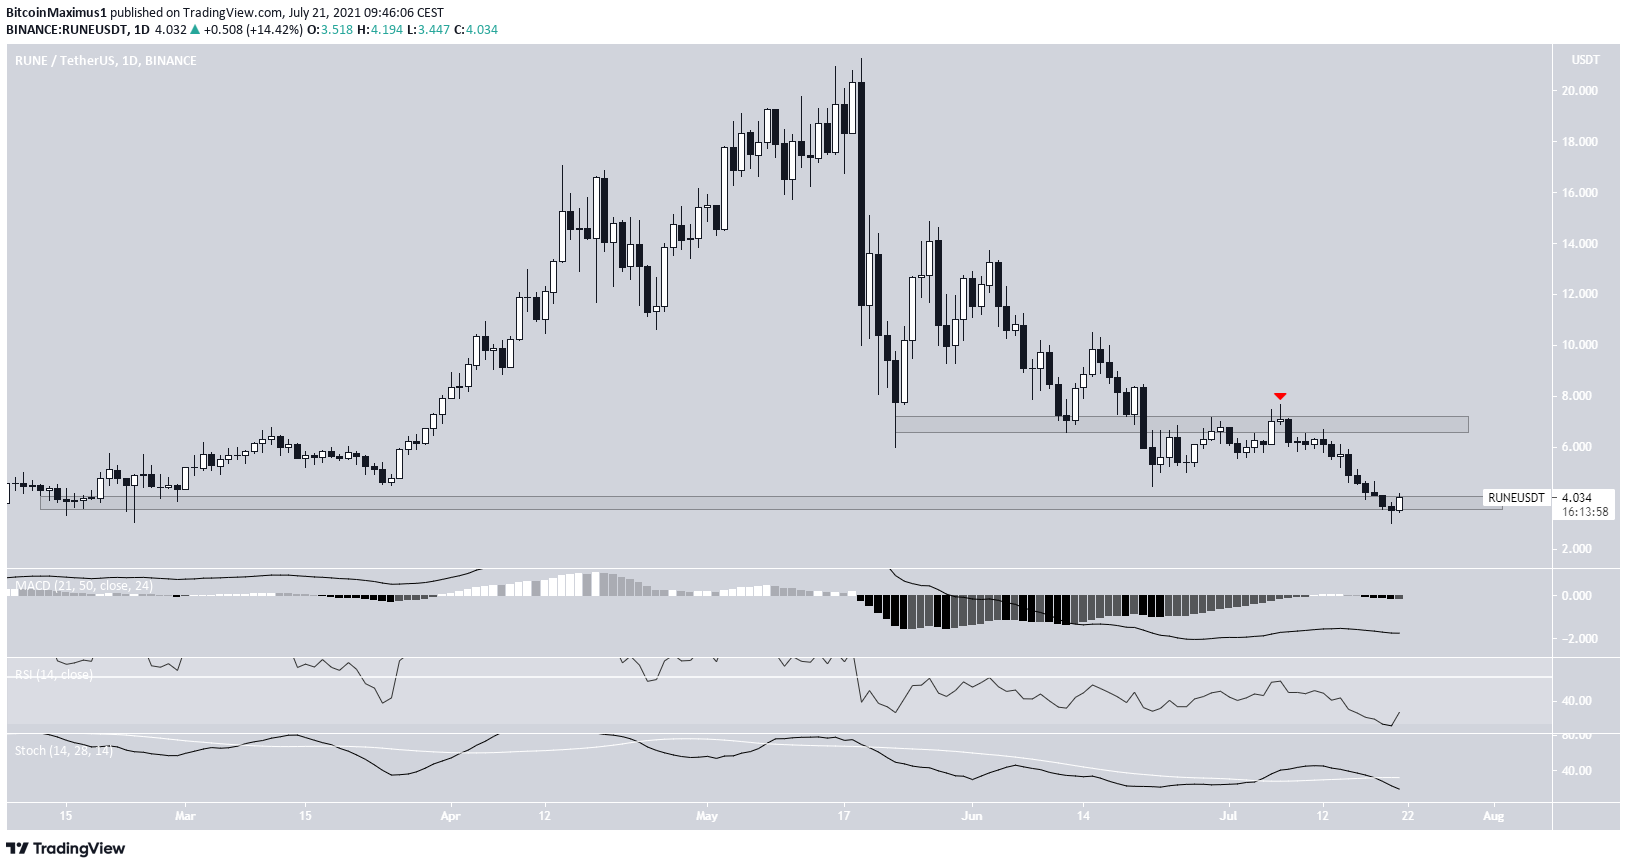
RUNE has been moving downwards since July 7 after beings rejected by the $7 resistance area (red icon).
On July 20, it reached a low of $3.01 and bounced significantly. The bounce validated the $3.60 horizontal support area.
If the positive movement can sustain, RUNE will likely retest the $7 area once more.
For BeInCrypto’s latest bitcoin (BTC) analysis, click here.
Disclaimer
All the information contained on our website is published in good faith and for general information purposes only. Any action the reader takes upon the information found on our website is strictly at their own risk.
 Bitcoin
  Ethereum
  Tether
  BNB
BNB  USDC
USDC  XRP
XRP  Solana
  TRON
TRON  Figure Heloc
  Hyperliquid