- Dogecoin snapped a five-day losing streak on Friday.
- Key resistance in the near-term is located at $0.0570.
- A daily close below $0.04750 could drag the price fresh multi-month lows.
Dogecoin closed in the negative territory for five straight days and touched its lowest level in two weeks at $0.04965 before staging a rebound on Friday. As of writing, DOGE was posting modest daily gains at $0.05480.
Dogecoin closes in on key resistance
The 20-day SMA and the 50-day SMA are both located a little above the current price level at around $0.0570. Moreover, the Fibonacci 38.2% retracement of Jan. 28 – Feb. 7 upsurge is reinforcing that area as resistance. If Dogecoin manages to make a daily close above that hurdle, the door opens for additional gains toward $0.06630 (static resistance) and $0.06690 (Fibonacci 23.6% retracement).
On the other hand, the near-term outlook could turn bearish if DOGE flips $0.04760 (Fibonacci 50% retracement) support into resistance and bears could aim for fresh multi-month lows at $0.0380 (Fibonacci 50% retracement).
Dogecoin one-day chart
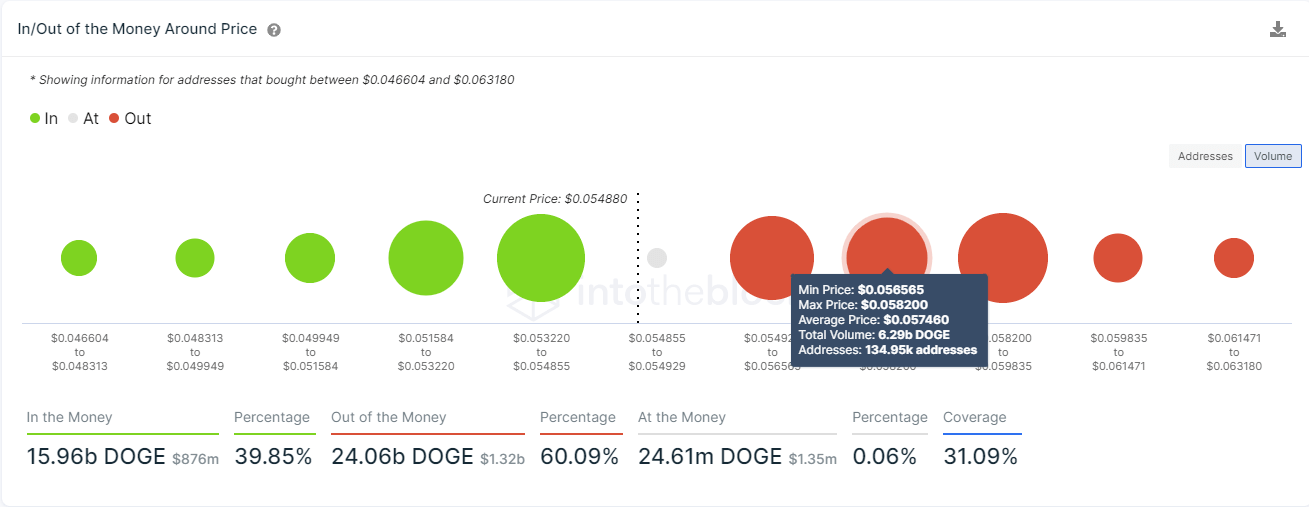
IntoTheBlock’s In/Out of the Money Around Price (IOMAP) model shows that the price remains stuck between strong resistance and support areas. The significance of the $0.0570 hurdle is confirmed by the IOMAP, which shows that more than 6.2 billion DOGE had been acquired by nearly 135K addresses $0.05746.
On the flip side, the IOMAP suggests that sellers could have a difficult time bringing the price down to the key $0.04760 area identified above with several strong support areas forming before it.
Although Dogecoin continues to move sideways in the big picture, the recent price action and the IOMAP chart point to possible additional gains if the coin manages to clear $0.0570.


 Bitcoin
  Ethereum
  XRP
XRP  Tether
  Solana
  USDC
USDC  Lido Staked Ether
  TRON
TRON  Dogecoin