

Bitcoin holds near $80,000 as XRP rebounds and Zcash regains a key average. Daily charts track support and resistance for BTC, XRP, ZEC, NEAR and Stellar today.
| Asset | USD price | 24-hour change | Aggregate 24-hour volume | Market-cap rank |
|---|---|---|---|---|
| Bitcoin (BTC) | $79,734 | +0.51% | $26.74 billion | 1 |
| XRP | $1.30 | +2.00% | $1.36 billion | 5 |
| Zcash (ZEC) | $1,220.82 | +3.63% | $808.14 million | 10 |
| NEAR Protocol (NEAR) | $4.42 | −0.24% | $500.44 million | 20 |
| Stellar (XLM) | $0.167994 | +0.75% | $89.13 million | 19 |
Bitcoin’s Daily MACD Weakens Near $80,000
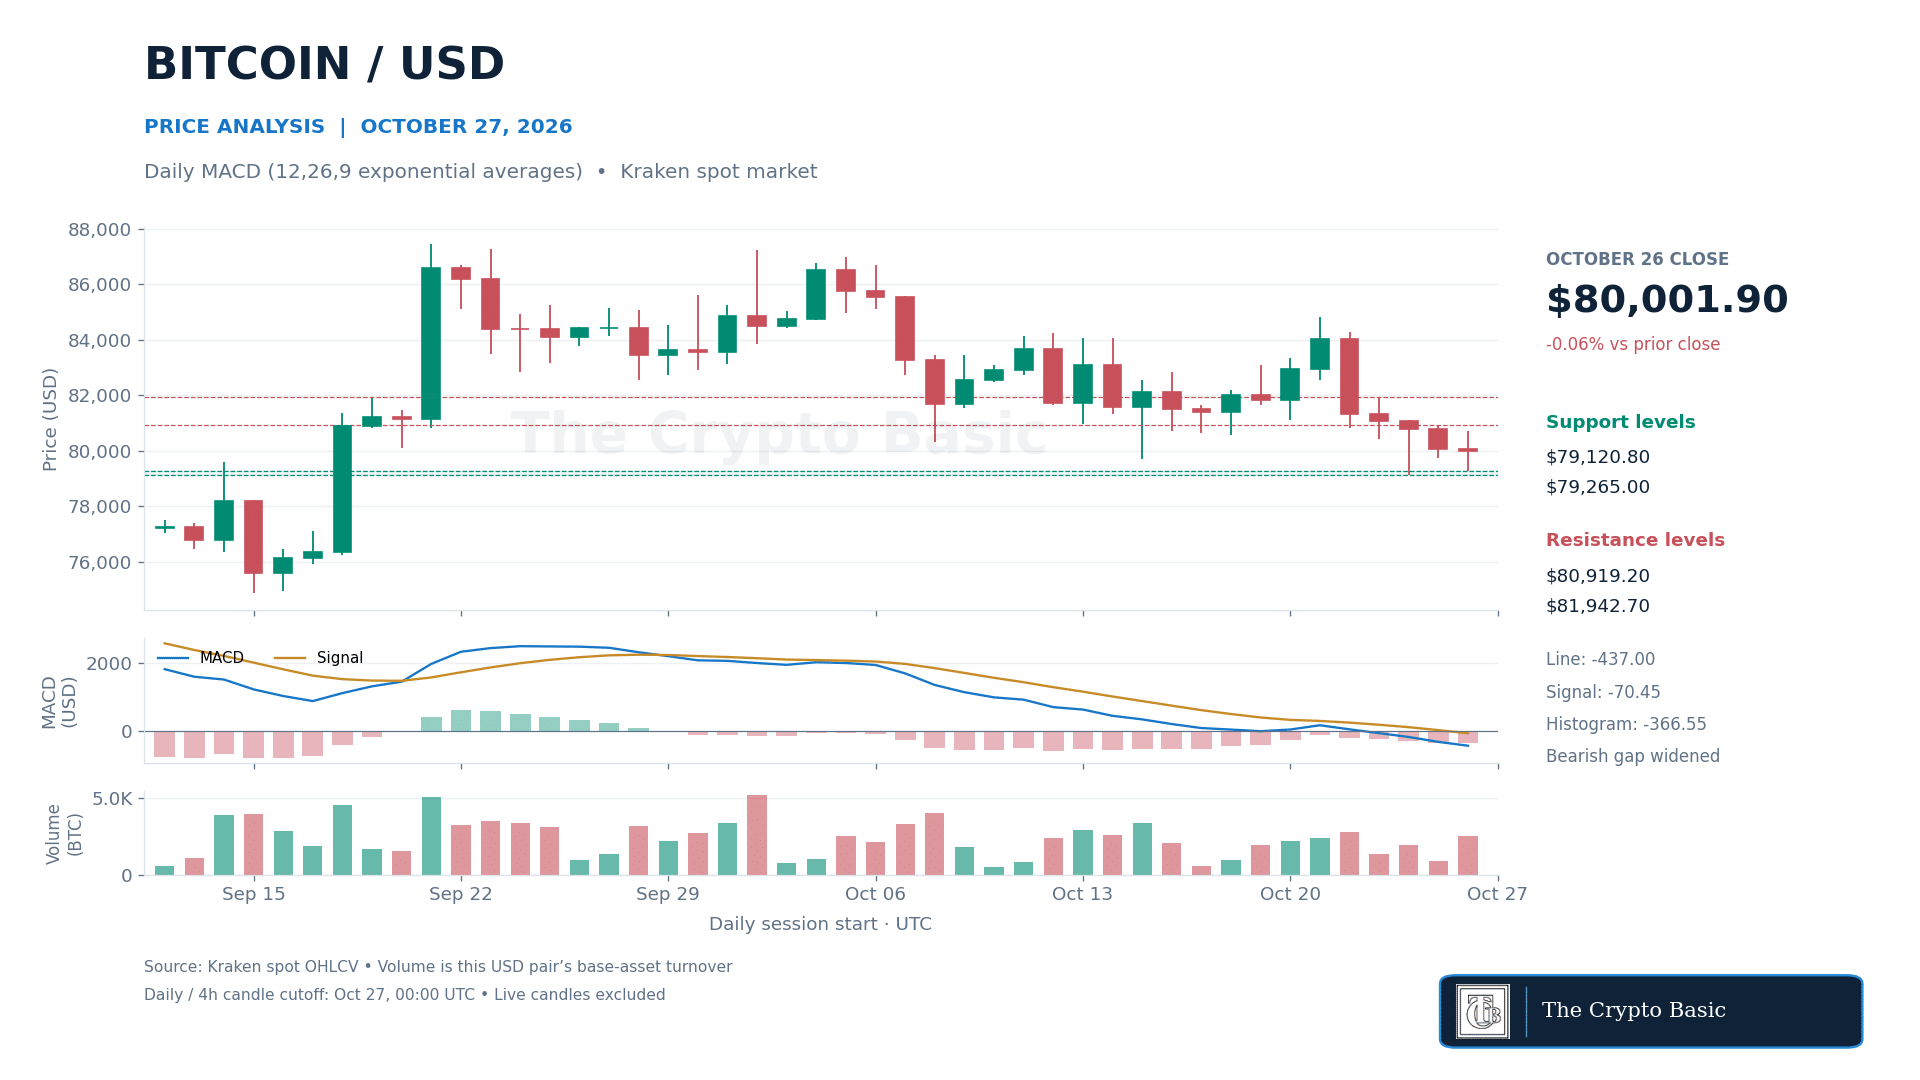
Bitcoin closed Monday at $80,001.90, down just 0.06% from Sunday’s $80,048.50. That small change concealed another lower daily high: Monday topped out at $80,701.70, below Sunday’s $80,919.20 and Saturday’s $81,101.
Daily MACD, using 12- and 26-period exponential moving averages with a nine-period signal EMA, remained bearish. Its line stood at −437.00 against a signal line of −70.45.
The histogram fell from −345.50 to −366.55, showing a wider negative gap on a completed candle. This was a deterioration in momentum, not a new bullish crossover.
The latest completed four-hour histogram was positive at 18.19, with the MACD line above its signal. That points to a short-term improvement, but both lines remained below zero and the daily signal had not followed.
The $79,120.80 weekend low highlighted in Monday’s report remained intact. Monday’s $79,265 low adds a nearby support reference. A daily close below $79,120.80 would invalidate the current attempt to build a floor.
Conversely, a daily close above $80,919.20–$81,101 would interrupt the sequence of lower highs and bring the October 23 high of $81,942.70 into focus. Until then, the rebound remains within a weakened daily structure.
XRP RSI Improves but Resistance Remains Overhead
XRP ended Monday at $1.30674, up 0.92%, after recovering from $1.27106. Its close approached the $1.31000–$1.31383 highs recorded over the last two sessions without clearing them.
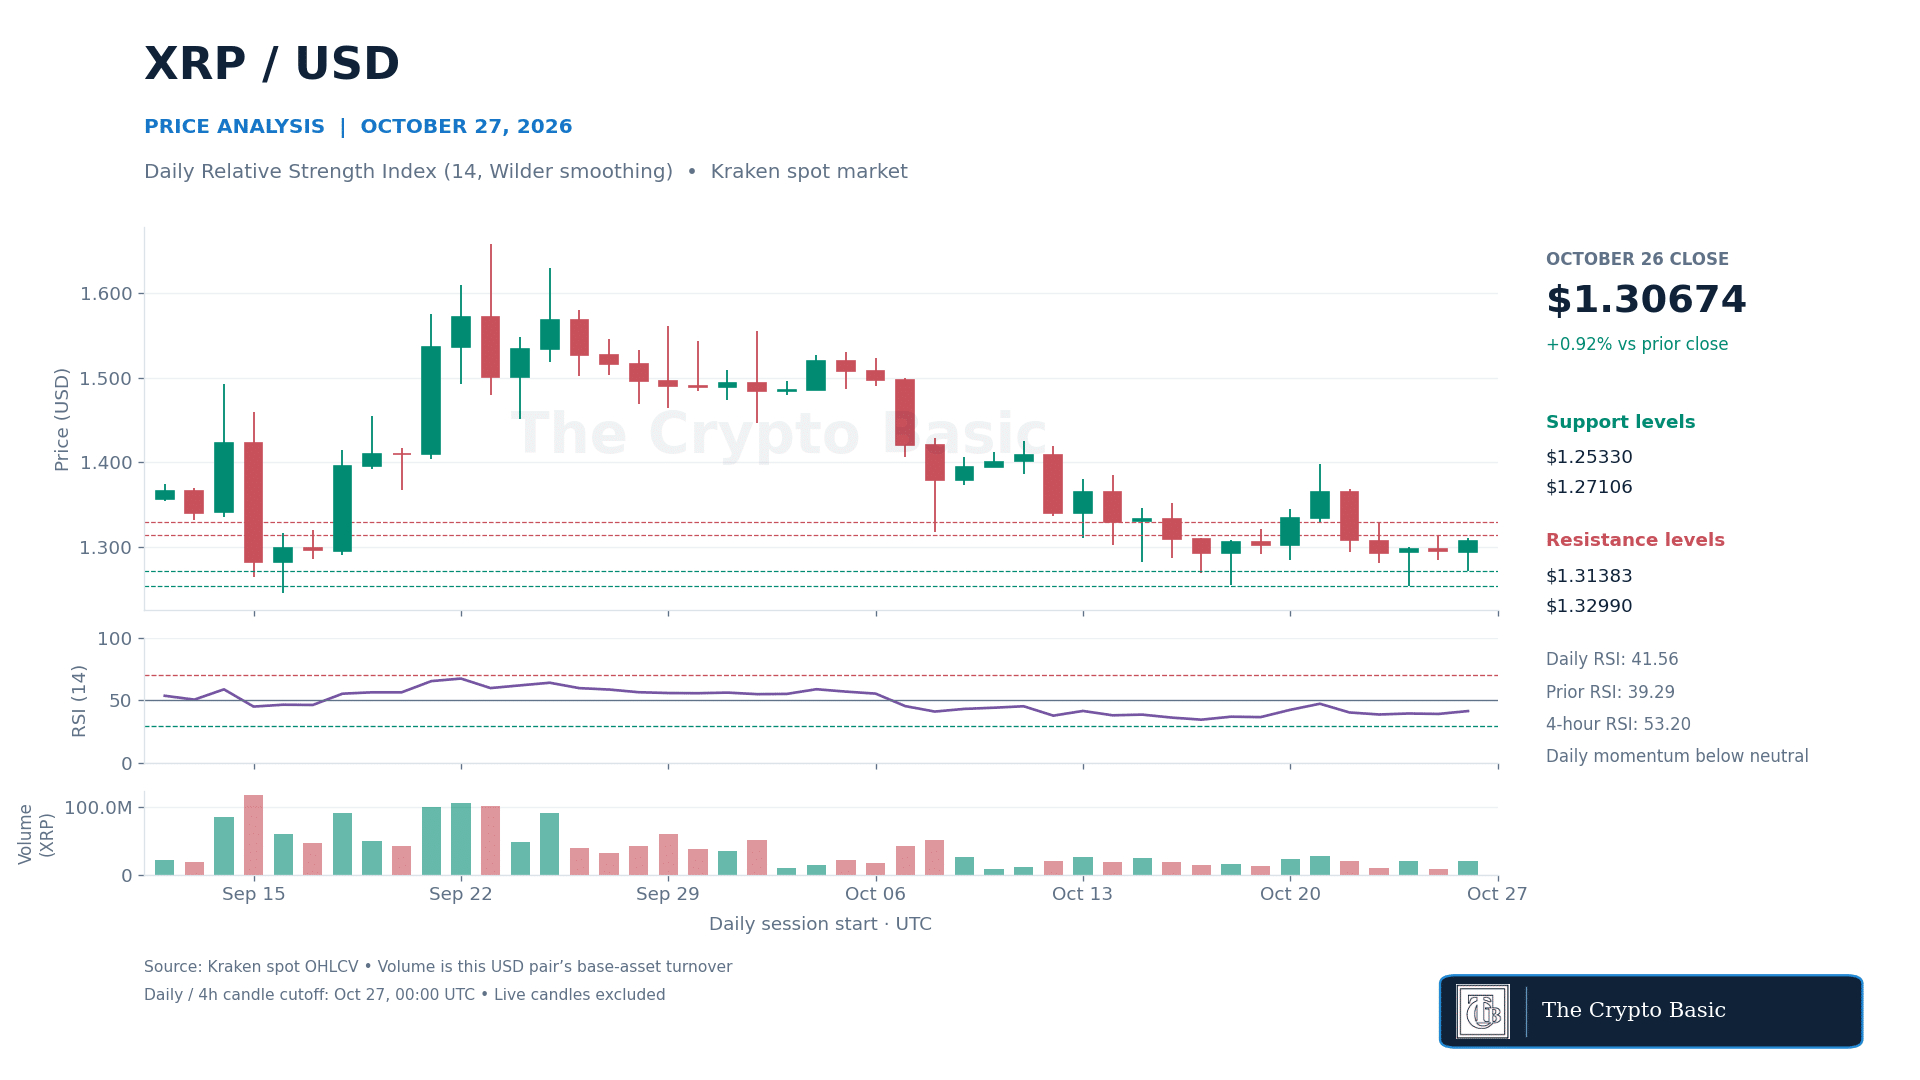
The daily 14-period Relative Strength Index, calculated with Wilder smoothing, rose to 41.56 from 39.29. Selling momentum eased, but the reading remained below the neutral 50 level. The improvement therefore falls short of a stronger daily momentum recovery.
The latest completed four-hour RSI was higher at 53.20, indicating that the shorter-term recovery was ahead of the daily chart.
A daily close above $1.31383 would clear the immediate hurdle and expose $1.32950–$1.32990, an area formed by the October 23 high and October 21 low. Holding above that zone would make the recovery more convincing. An intraday move above resistance would still require closing confirmation.
Failure to clear the nearby highs leaves $1.27106 as the first downside reference. A daily close beneath it would weaken the rebound and put Saturday’s $1.25330 low back in view.
That low already undercut the $1.25477 support discussed in the October 24 report, showing that the recent recovery followed further weakness in the earlier structure.
Zcash Reclaims Its 20-Day Average
Zcash closed Monday at $1,230.88, gaining 1.60%. That placed it just above the 20-day exponential moving average at $1,229.28 and above the 50-day EMA at $1,193.15.
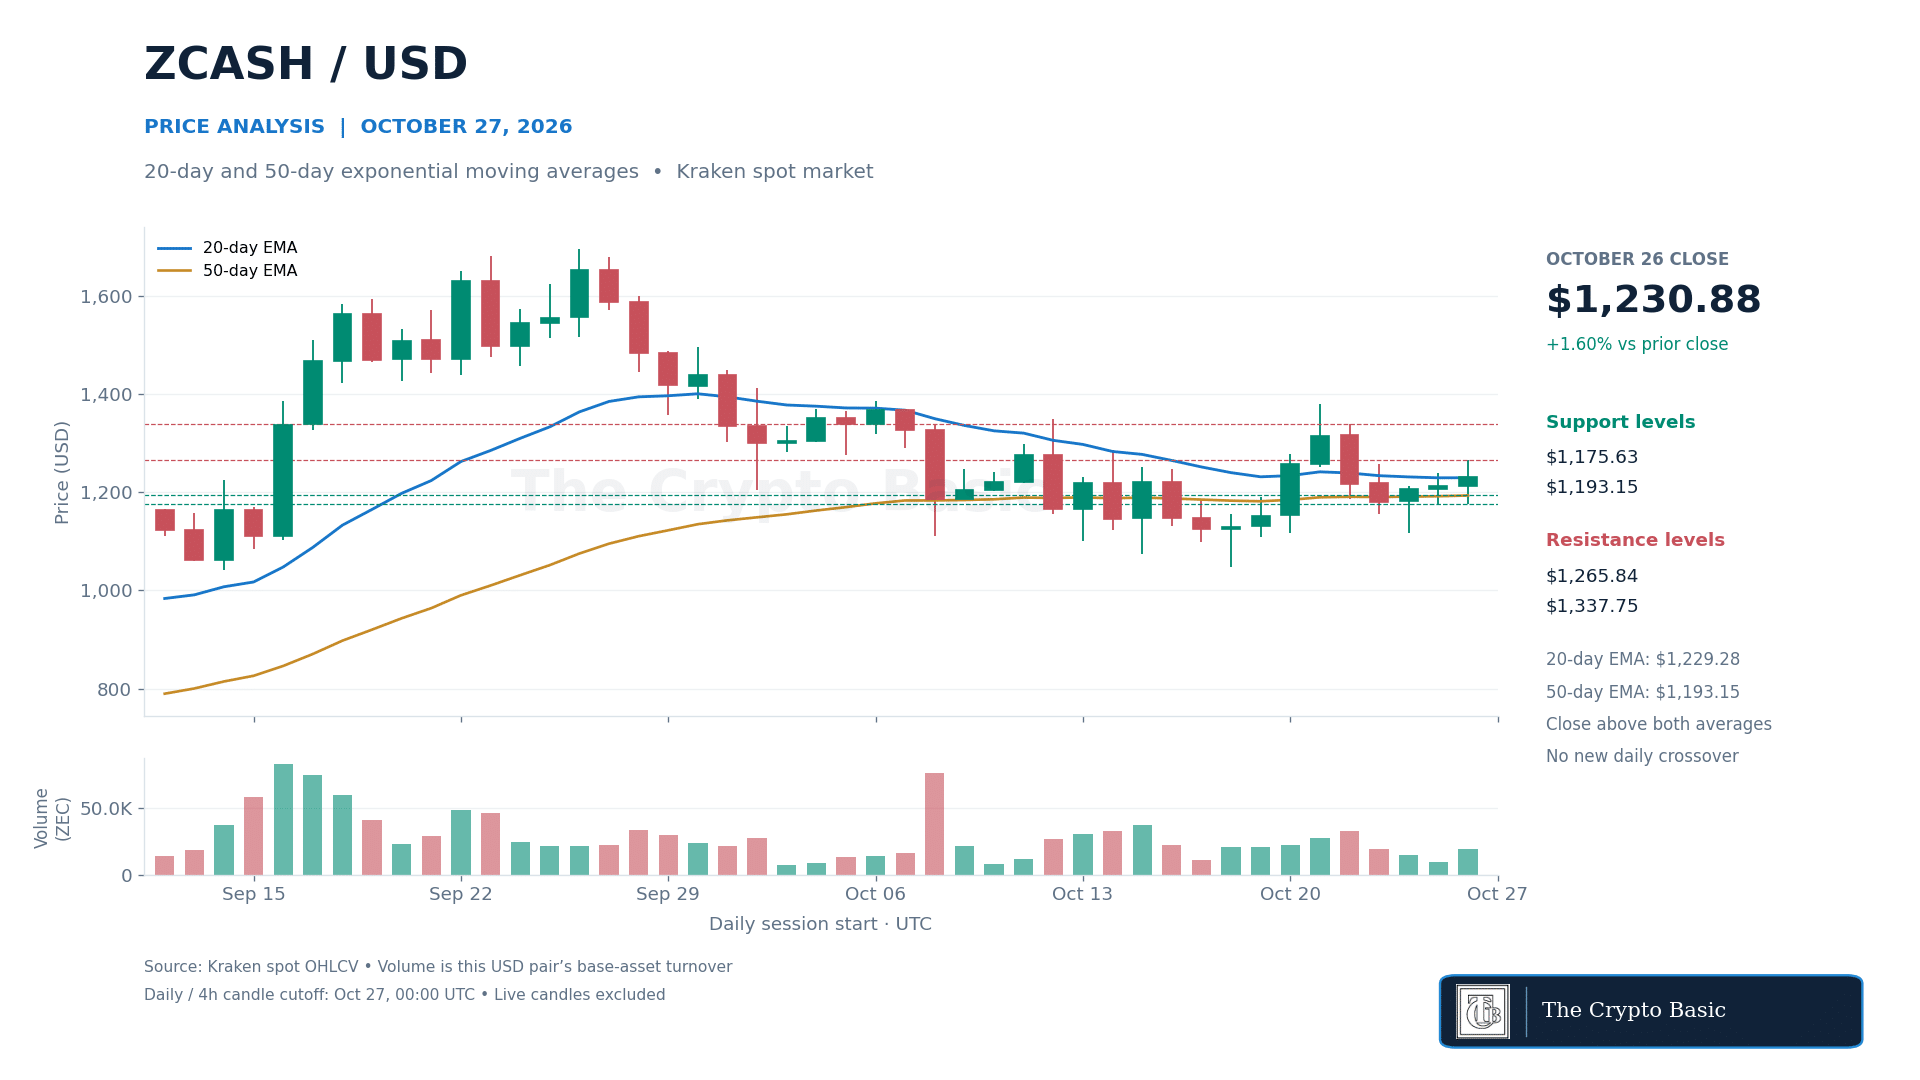
The recovery above the shorter average was narrow: the close exceeded it by only $1.60. The latest price of $1,220.82 had slipped back below that reference, leaving Tuesday’s eventual close important for confirming whether the reclaim holds.
There was no new crossover between the two averages. The 20-day EMA was already above the 50-day EMA, so the latest development concerns price recovering the faster average.
Zcash traded 4.07% above the $1,173.07 price recorded in our October 24 report. Monday’s $1,265.84 high also exceeded the October 23 high of $1,257.35, although the daily close failed to hold above that older barrier.
A daily close above $1,265.84 would confirm a break of Monday’s high and improve the recovery toward $1,337.75, the October 22 high.
Another close below the 20-day EMA would weaken the immediate reclaim. Losing the 50-day EMA would expose the $1,175.63–$1,176.53 lows of the last two sessions.
A close below that area would invalidate the near-term recovery and reopen Saturday’s $1,117.29 low. The averages will change with subsequent closes.
NEAR Remains Below a Falling Bollinger Midpoint
NEAR closed Monday at $4.5025, down 1.87%, with its entire daily range inside Sunday’s range. That describes consolidation after the weekend decline rather than a fresh closing breakdown on Monday.
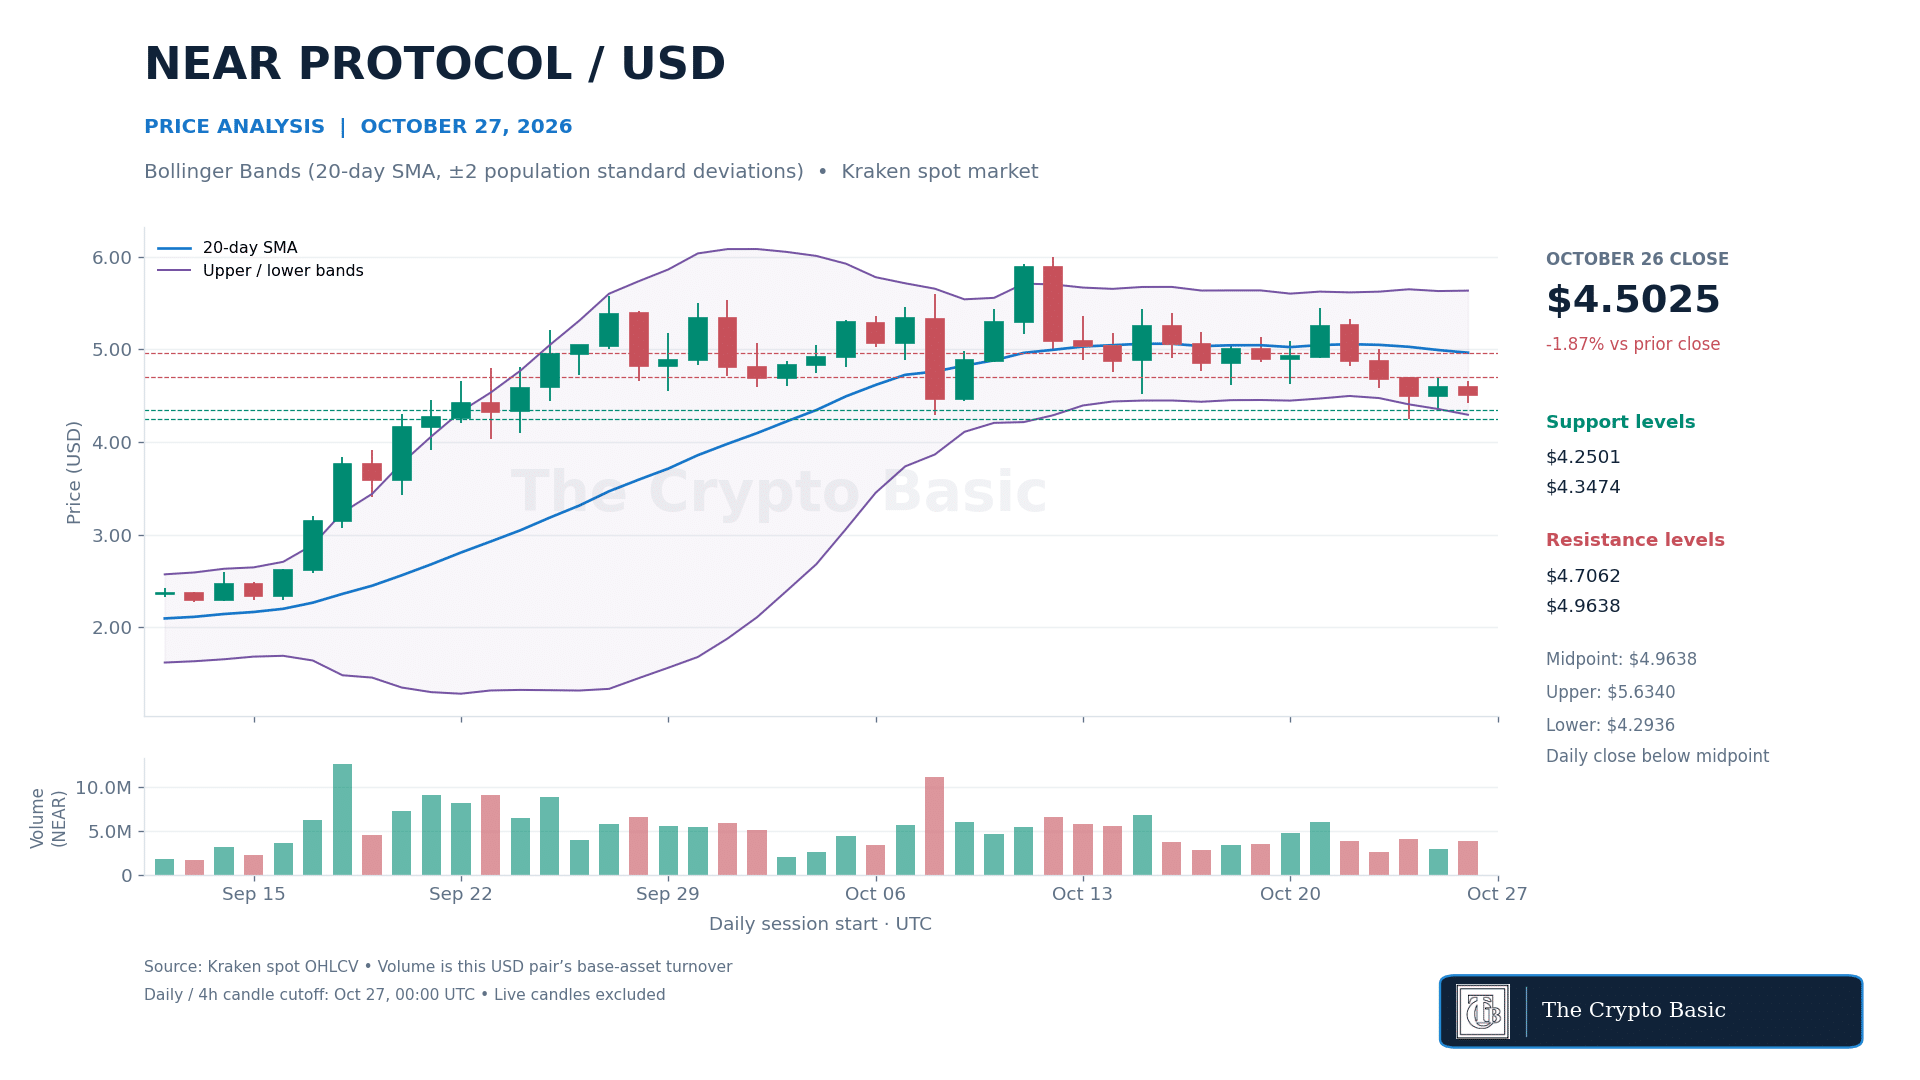
Daily Bollinger Bands, calculated from a 20-day simple moving average and two population standard deviations, placed the midpoint at $4.9638 and the lower band at $4.2936.
Price remained below the falling midpoint, leaving the broader recovery incomplete. The lower band provides a moving volatility reference rather than guaranteed support.
At $4.42, NEAR traded 4.74% below the $4.64 price recorded in our October 24 report. Saturday’s $4.4954 close had already fallen below the previously watched $4.5491–$4.5816 support area.
A daily close above $4.6559–$4.7062 would clear recent session highs and strengthen a rebound toward the band midpoint and the October 23 high at $5.0075.
Failure to recover those highs leaves Monday’s $4.4194 low and Sunday’s $4.3474 low as nearby downside references. A daily close below Saturday’s $4.2501 low would invalidate the consolidation floor and extend the decline.
Until one boundary gives way, the latest inside day does not establish a new directional move.
Stellar Sets a New Low Despite a Higher Close
Stellar closed Monday at $0.169096, up 0.76%, but reached a new 60-day low of $0.165886 during the session. Its $0.170762 high was also below Sunday’s $0.172187 high, preserving the sequence of lower highs.
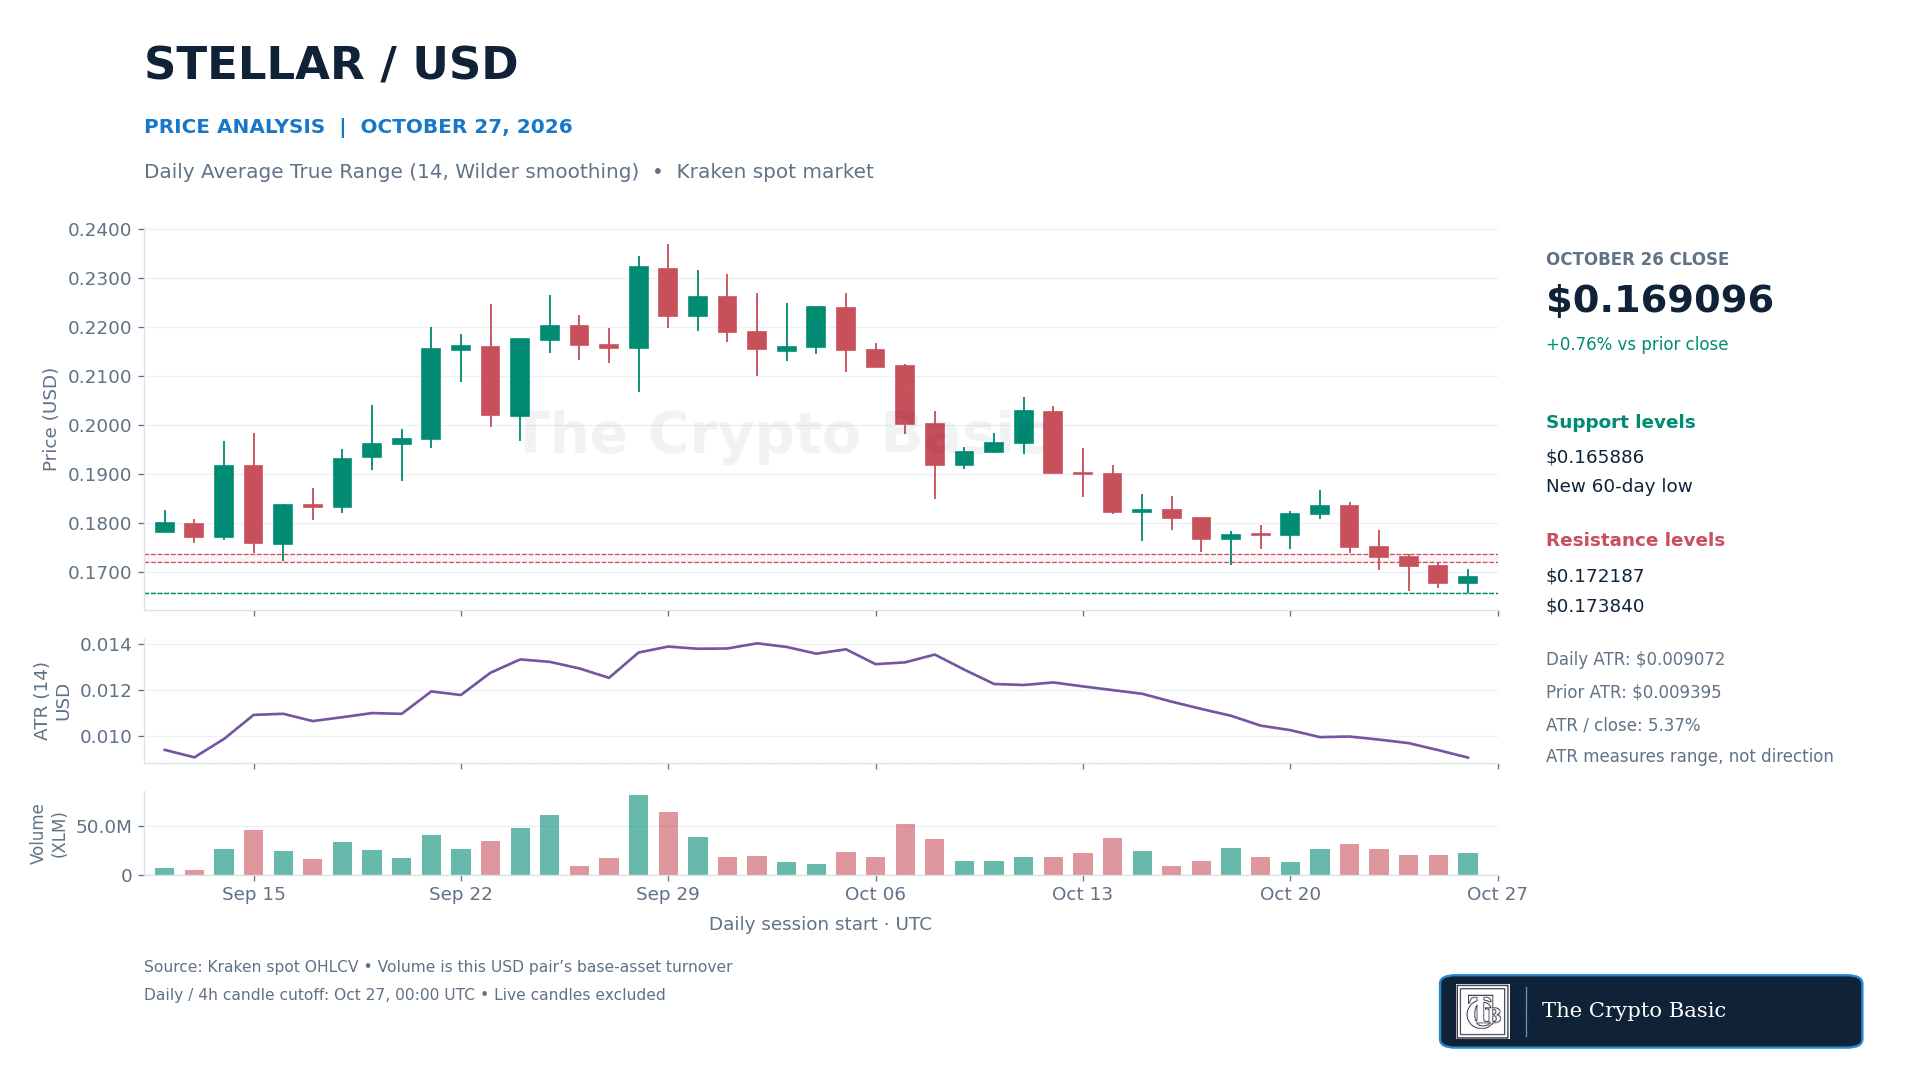
The daily 14-period Average True Range, calculated with Wilder smoothing, fell to $0.009072 from $0.009395. Recent trading ranges have narrowed, but ATR remained equivalent to approximately 5.37% of the closing price.
ATR measures volatility. Its decline does not establish a bullish signal or confirm that a bottom has formed, particularly while price continues to register lower highs and lows.
The immediate recovery test is $0.170762–$0.172187. A daily close above that zone would break the latest sequence of lower session highs and bring Saturday’s $0.173840 high into focus. Clearing that second hurdle would give the rebound stronger price confirmation.
The bearish alternative is a daily close below $0.165886. That would invalidate Monday’s recovery from its low and extend the decline to another 60-day low.
Until price clears the recent highs, the smaller ATR reading describes reduced volatility within a weak trend rather than a confirmed reversal.
 Bitcoin
 Ethereum
 Tether
 BNB
 XRP
 USDC
 Solana
 TRON
 Figure Heloc
 Zcash
