

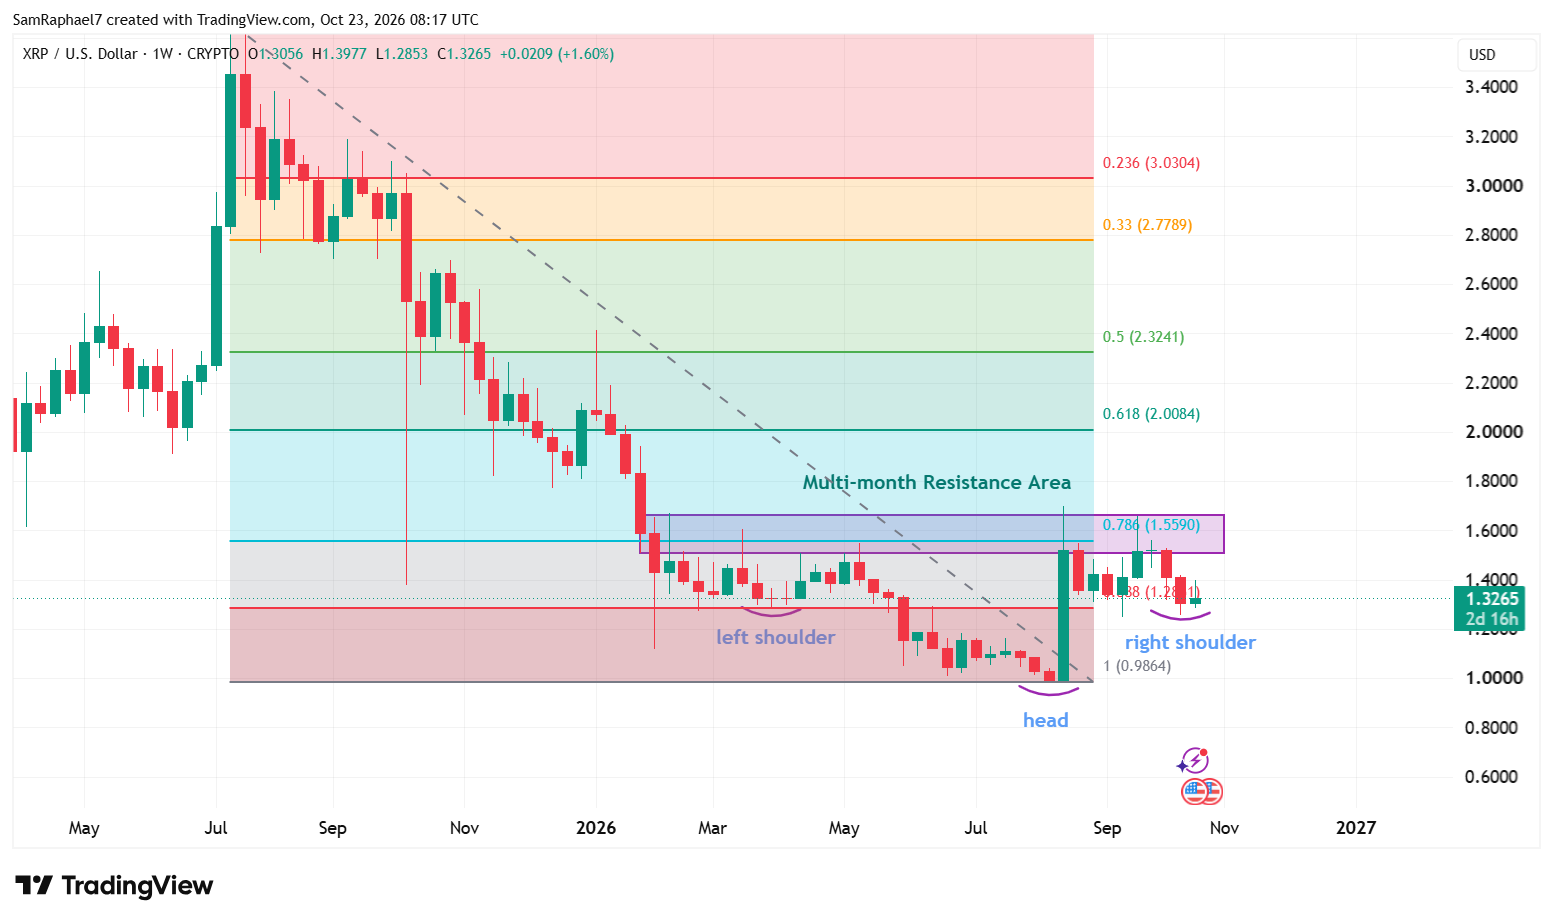
Amid the ongoing price struggles, XRP is forming an inverse head and shoulders pattern that shows the key resistance zone it must break to rally above $2.
XRP may be forming a bullish reversal pattern that could support a rally above $2, but the cryptocurrency must first break through an important resistance zone.
XRP Continues to Struggle
XRP has faced selling pressure since the beginning of October 2026, as shown on its weekly chart. The cryptocurrency gained just 0.26% in the week ending Oct. 4 before recording losses over the next two consecutive weeks. These declines wiped out nearly 15% of its value during the period.
XRP has started to recover this week, gaining 1.49% so far. However, the rebound has done little to offset its recent losses, as the asset remains down more than 11% in October. While the price has begun to recover, the broader monthly trend remains negative.
Despite these struggles, chart data suggests XRP may be close to the completion of an inverse head and shoulders pattern that could lead to higher prices.
XRP Forms Inverse Head and Shoulders Pattern
For context, an inverse head and shoulders is a bullish chart pattern that typically forms after a downtrend. Traders watch for this formation because it can indicate a possible change from falling prices to an upward trend.
The pattern has three lows, with the middle low, known as the head, extending below the two outer lows, which form the shoulders. A neckline connects the price highs between these lows, and the asset must break above this line to confirm the bullish reversal.
For XRP, the neckline falls within a multi-month resistance zone. Breaching above this area could confirm the pattern and create an opportunity for the cryptocurrency to rise above $2.
XRP Forms the Left Shoulder, Head, and Right Shoulder
XRP began forming the pattern when its price fell to $1.2795 in the week ending April 5, 2026. This decline marked the left shoulder. The cryptocurrency later dropped further, reaching a low of $0.9874 in mid-August 2026 and forming the head of the pattern.
After recovering from the August low, XRP appears to have formed the right shoulder during the latest market-wide pullback. The decline took the price to $1.2550 before buyers stepped in and pushed it higher again.
At the time of writing, XRP trades above $1.32 as the recovery continues. However, the cryptocurrency remains well below the neckline. It must break above this level before the inverse head and shoulders pattern can confirm a potential bullish reversal.
Multimonth Resistance Between $1.5093 and $1.6667
The neckline lies between $1.5093 and $1.6667, a resistance zone that has limited XRP’s recovery attempts since February 2026. The area became a major barrier after XRP fell below it during the market crash early in 2026, eventually reaching a low of $1.1188 in the week ending Feb. 8, 2026.
Since then, XRP has made several attempts to move above this zone, but sellers have repeatedly stopped its advances. The cryptocurrency encountered resistance at $1.6698 in February, $1.6061 in March 2026, $1.5102 in April 2026, and $1.5487 in May 2026.
Further attempts also failed at $1.6977 in August 2026 and $1.6569 in September 2026. Most recently, XRP faced resistance at $1.5599 in the week ending Oct. 4, 2026.
The resistance zone existed before the inverse head and shoulders pattern began to form. However, its alignment with the pattern’s neckline now makes the area even more important. XRP must overcome this barrier to break out of the developing pattern.
XRP Could Rise Above $2 After Breaking Resistance
A move above the $1.5093 to $1.6667 zone would mark an important step for XRP. This breakout would allow the cryptocurrency to clear a resistance area that has restricted its price for months and also break above the neckline of the inverse head and shoulders pattern.
If buyers maintain their momentum after the breakout, XRP could extend its recovery toward higher levels. However, the strength of buying pressure will help determine whether the price can sustain an upward move.
Fibonacci retracement levels also show a possible path toward $2.0084. According to chart data, XRP faces no meaningful resistance between the identified resistance zone and the 0.618 Fibonacci retracement level at $2.0084.
 Bitcoin
 Ethereum
 Tether
 BNB
 XRP
 USDC
 Solana
 TRON
 Figure Heloc
 Zcash
