

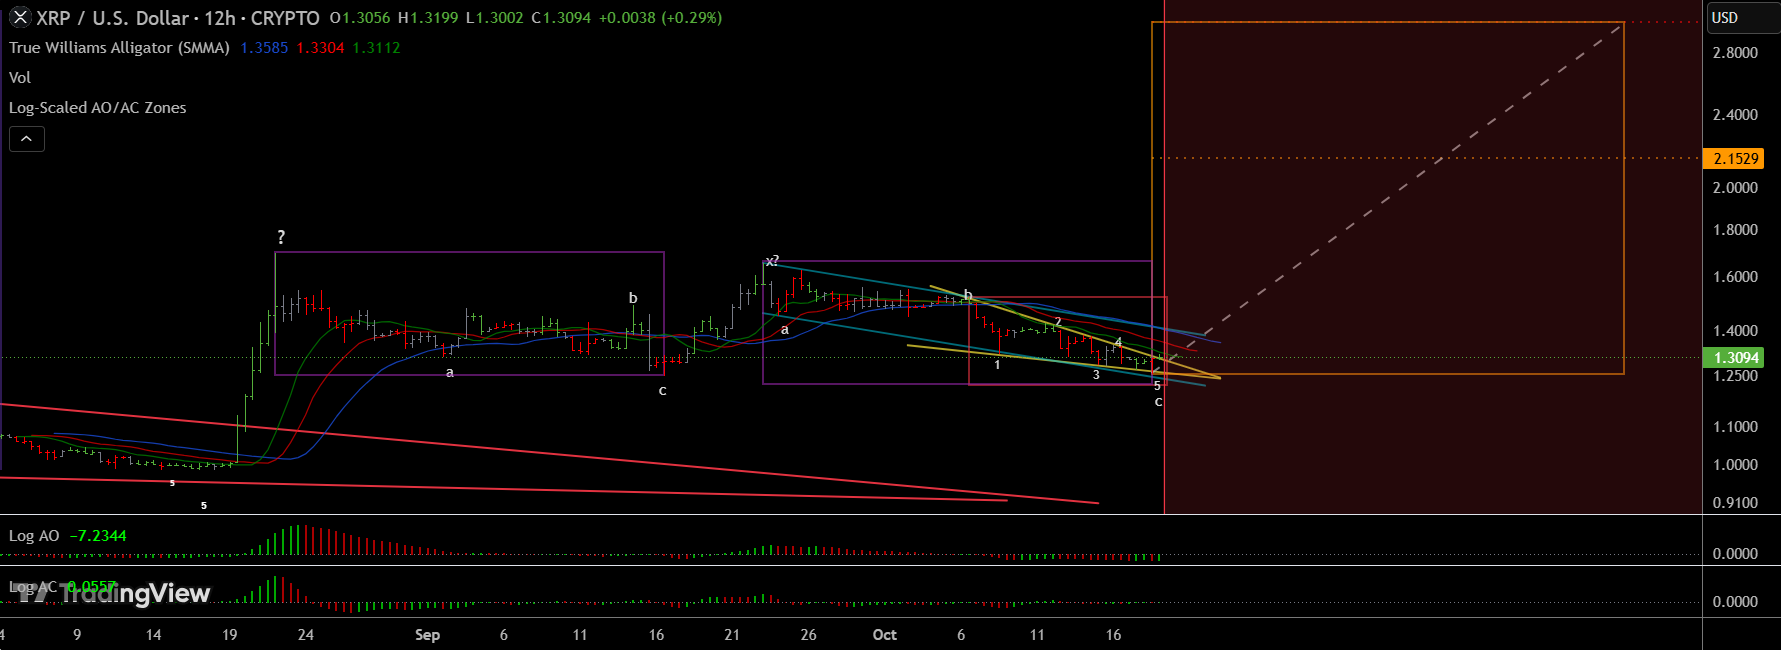
XRP may be nearing the end of its months-long correction after breaking above a contracting wedge near $1.30.
The chart suggests that three separate timing counts within the correction are reaching their limits at the same time, which raises the probability of a price recovery.
XRP trades at $1.3094 after hitting a session low of $1.3002 on the 12-hour chart. The decline followed a double corrective pattern that began after XRP reached $1.70 in August. The latest price action suggests that the final wave of this pattern may be ending.
XRP Double Zigzag Correction Nears Its End
XRP’s decline from its August high of $1.70 developed through two corrective waves, each following a three-part a-b-c zigzag pattern, with an x-wave linking the two formations.
The first zigzag began with wave a, which took XRP from $1.70 to $1.34 by Sept. 2. Wave b then pushed the price back up to $1.49 before wave c sent it down to $1.31. The connecting x-wave appears near the Sept. 16 peak of around $1.65.
The second zigzag started at the Sept. 16 peak of $1.65. Wave a drove XRP down to $1.45 by Sept. 24, while wave b brought a recovery to $1.52 by Oct. 6. Wave C then began and carried the price toward the recent low of $1.30. This final decline may now be completing the broader double zigzag pattern.
Terminal Wedge Forms Within Wave-C
The final wave-c of the second zigzag developed into a terminal impulse. This pattern has five internal waves that form a contracting wedge, not the more typical structure of a standard impulse. The chart marks these waves from 1 to 5, with their highs and lows narrowing into a cone as the price moves lower.
The waves overlap, which confirms the terminal interpretation and shows the pattern is different from a conventional impulse. Wave 3 contains a large internal b-wave, while wave 4 develops over a relatively short period.
Despite these features, the contracting shape and overlapping price movements confirm that the pattern may mark the final stage of the decline.
The terminal formation began near $1.40 and moved through five stages toward the current region above $1.30. Wave 5 of c, the final sub-wave of the entire double zigzag, appears to be completing near the $1.3002 low.
The True Williams Alligator also suggests a possible change in trend. Its three smoothed lines read 1.3585, 1.3304, and 1.3112, which place them close together just above the current price. This clustering can occur when a trend approaches its end.
Three Correction Clocks Reach Their Limits Together
The correction’s timing also suggests an imminent reversal. The double zigzag as a whole is approaching its expected time limit, while wave-c is nearing its own. At the same time, the fifth wave of the terminal impulse is reaching the end of its projected duration.
These three timing counts operate at different levels of the same price structure, but they eye the same period in late October 2026. Their alignment confirms the case for a possible turning point because several parts of the correction are reaching their expected limits together.
However, timing alone cannot confirm that XRP has reached a lasting bottom. The price must support the technical outlook by holding near $1.30 and continuing to show signs of recovery.
XRP Price Targets Range From $2 to $3
If the double zigzag correction has ended, a standard price projection method points to a possible rally toward $2 to $3. This method uses the length of the August upsurge, applies extensions of 100% to 161.8%, and projects the resulting distances upward from the corrective low near $1.30.
The chart marks a Fibonacci extension at $2.1529, which makes it the first major target within the projected range. The price path also extends toward $2.80 and above, showing how far XRP could rise if the expected recovery gains strength.
Meanwhile, the timing projection predicts a possible local top around mid-November 2026. If the pattern plays out as expected, XRP could recover relatively quickly from its current level. A move back toward $1.40, where the terminal impulse began, would provide an early sign that the recent low may hold.
XRP Must Hold $1.30 Support
The bullish case depends on XRP holding the $1.30 area. A break below the recent low of $1.3002 would weaken the current wave count and require a fresh assessment of the correction. Such a decline would not automatically rule out a broader recovery, but it would suggest that the correction may need more time to finish.
There is also uncertainty about the August rally that started the current price structure. It is not yet established whether that move marked the first wave of a new uptrend, a corrective wave-a, or part of a larger sideways pattern that is still in progress.
 Bitcoin
 Ethereum
 Tether
 BNB
 XRP
