

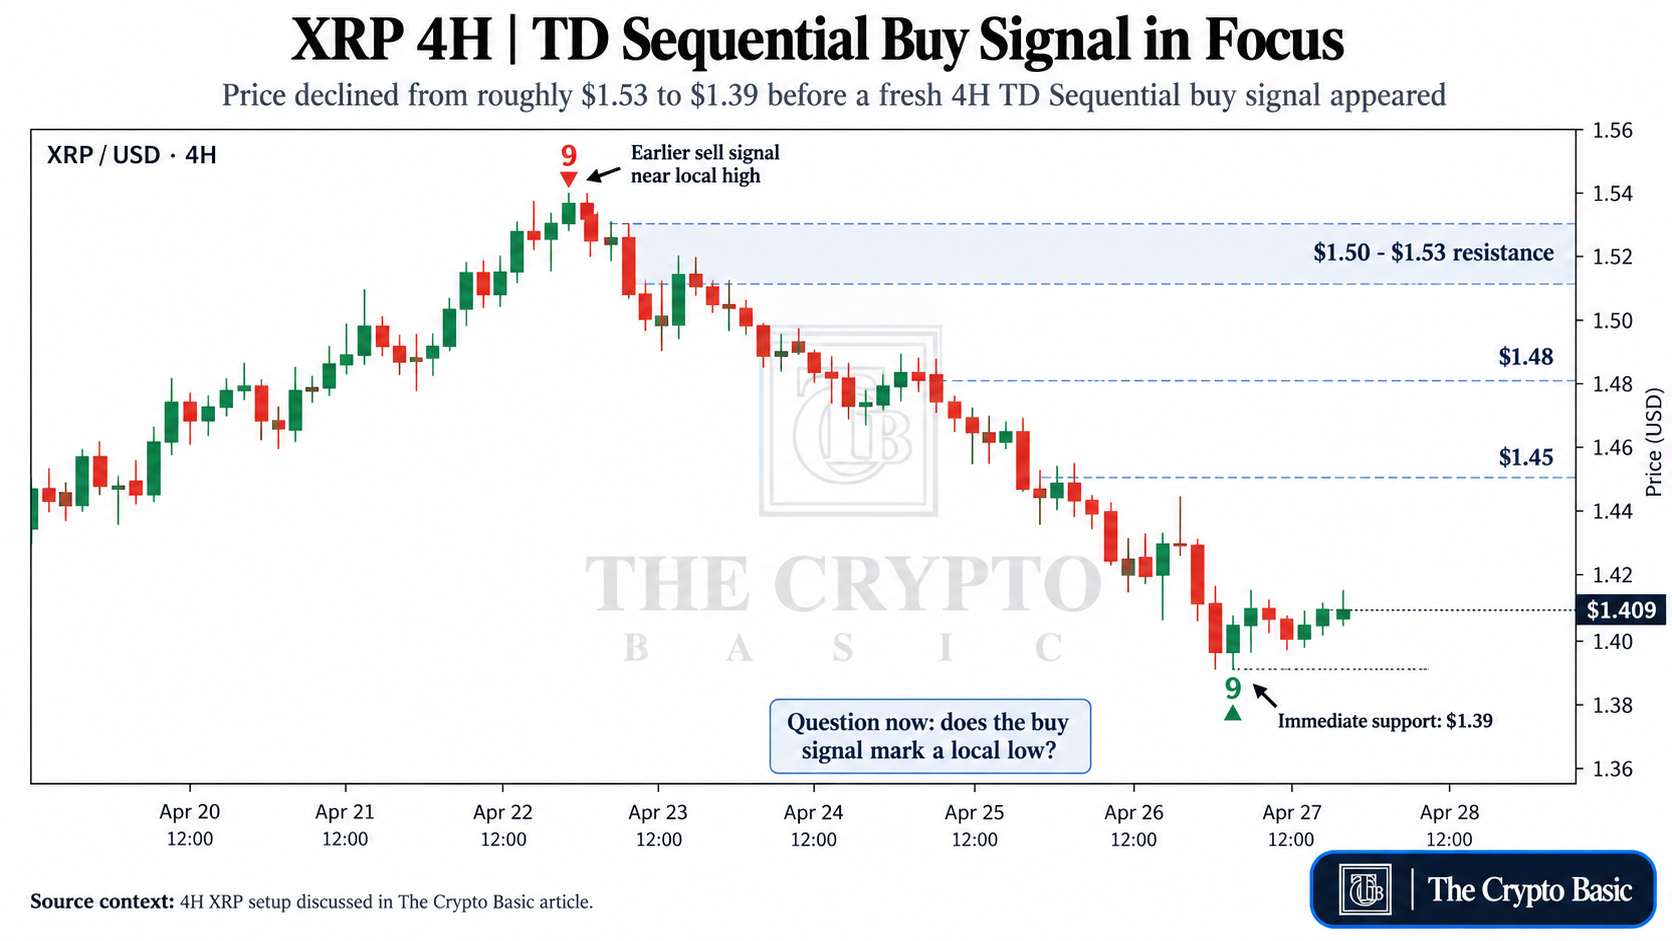
XRP flashes a fresh four-hour TD Sequential buy signal after falling from $1.53 toward $1.39, putting a potential short-term rebound into focus.
XRP has printed a fresh TD Sequential buy signal on the four-hour chart after falling from the $1.53 region toward $1.39.
The setup follows an earlier TD Sequential sell signal that appeared close to the recent local high before price turned lower.
The chart places XRP near $1.409, with the latest decline erasing roughly 9% from the recent peak.
Selling pressure has remained persistent across several four-hour candles, taking XRP through $1.48 and $1.45 before price reached the $1.39 area.
TD Sequential Flips From Sell to Buy
The TD Sequential indicator is designed to identify periods when a trend may be approaching exhaustion.
On the current chart, a “9” buy signal has now appeared near the latest candles. In this setup, the ninth candle can suggest that the existing move is becoming stretched enough for a pause or reversal attempt to develop.
The earlier signal adds context.
A previous “9” sell signal formed close to the $1.52-$1.53 area. XRP subsequently rolled over and moved steadily lower, eventually reaching $1.39.
The indicator has now flipped in the opposite direction after that decline.
This does not confirm that XRP has already established a durable bottom, but it puts the possibility of a short-term low or relief rebound back into focus.
$1.39 Is the First Level Bulls Need to Hold
The latest downside wick reached the $1.39 area, making it the nearest support visible on the four-hour setup.
If buyers continue defending this level, the first recovery area sits around $1.45.
Above that, XRP would need to reclaim $1.48, followed by the broader $1.50-$1.53 resistance zone where the selloff began.
That sequence matters because a bounce from $1.39 would still need to recover several broken levels before the short-term structure meaningfully improves.
On the other side, a sustained move below $1.39 would weaken the immediate reversal setup and show that sellers remain in control despite the TD Sequential buy signal.
For now, the chart leaves XRP at a clear inflection point: the indicator is signaling possible exhaustion after a sharp decline, but price still needs to prove that the $1.39 area can hold.
 Bitcoin
  Ethereum
  Tether
  BNB
BNB  XRP
XRP  USDC
USDC  Solana
  TRON
TRON  Figure Heloc
  Zcash
Zcash 