

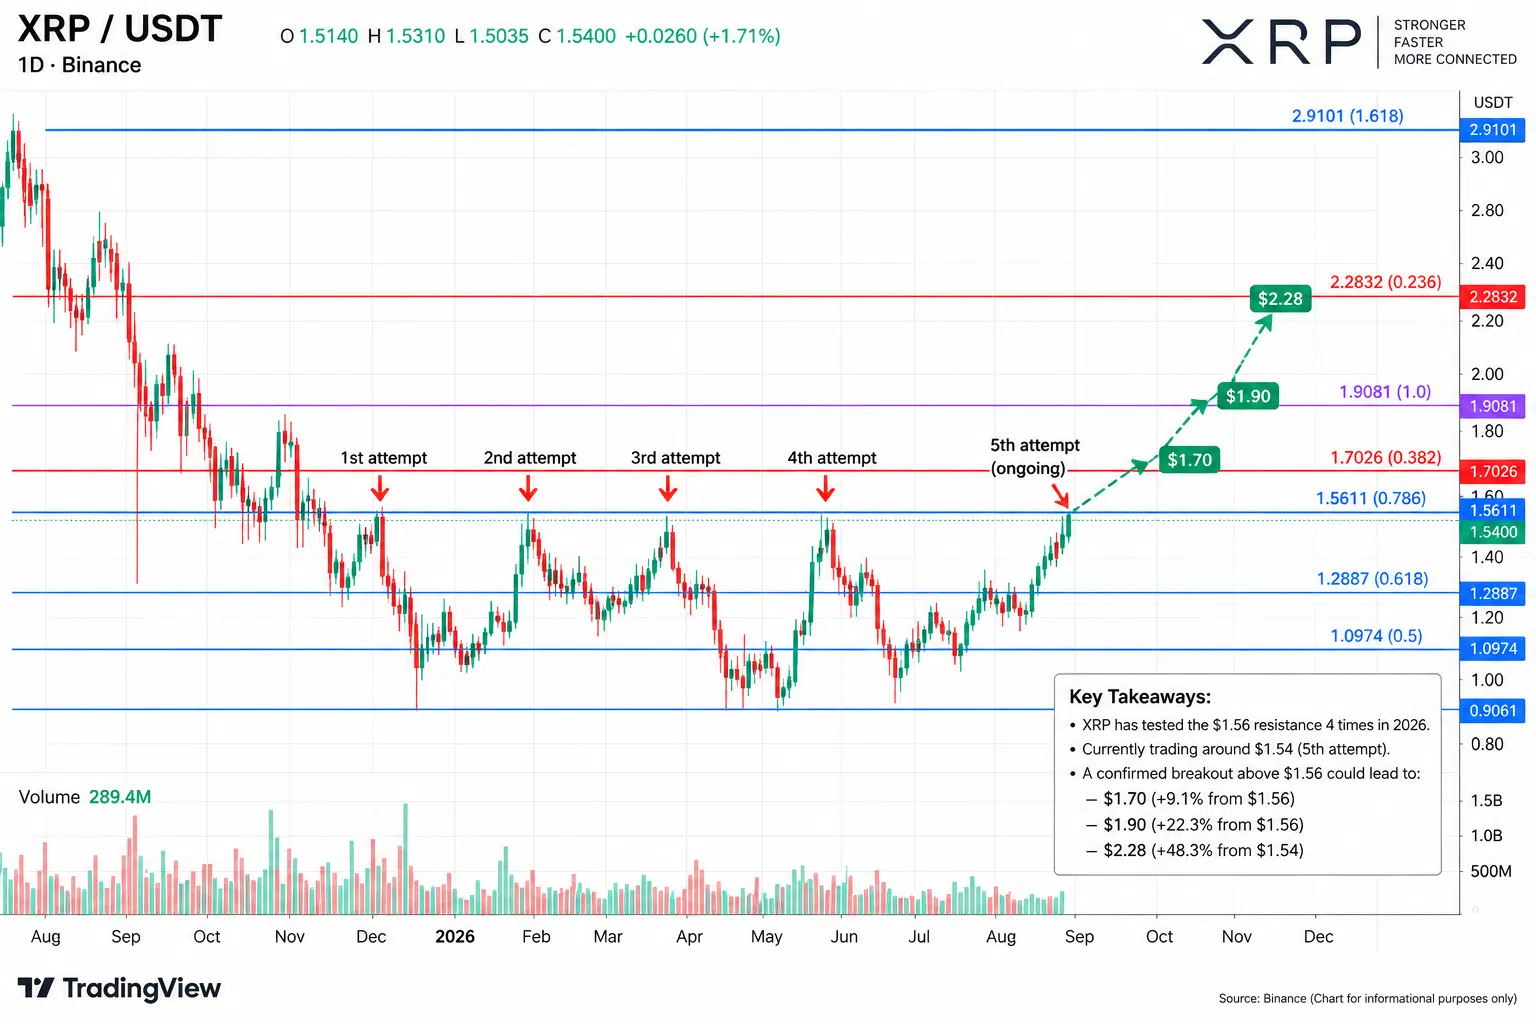
XRP approaches $1.56 resistance for a fifth attempt in 2026, with chart levels indicating $1.70, $1.90, and $2.28 if the resistance breaks.
XRP is approaching the $1.56 resistance area for the fifth time this year, with XRP currently trading around $1.54. The daily chart shows that the same region rejected four previous advances during 2026, making the latest test a continuation of a resistance structure that has persisted for several months.
The chart places the resistance at approximately $1.5611, corresponding to the displayed 0.786 Fibonacci level. XRP is now only about 1.4% below that threshold.
Four Previous Tests Stopped Near $1.56
The chart marks four earlier advances toward the $1.56 area between February and August. Each attempt was followed by a move back into the broader trading range rather than a sustained daily advance above the level.
The latest recovery began after XRP traded near $1.00 in August. Price subsequently jumped above $1.28 and returned toward $1.50. The current chart shows XRP around $1.5285, while the supplied current market price of $1.54 places it even closer to resistance.
The latest five daily candles show a recovery from roughly the $1.28–$1.30 region. Lower wicks during the pullback indicate intraday buying responses, followed by expanding bullish candles toward $1.50. The latest candles are again testing the upper boundary that stopped previous advances.
What Comes After $1.56?
If XRP records a sustained breakout above $1.5611, the chart identifies $1.7026 as the next major displayed Fibonacci level. From $1.56, that represents an additional increase of approximately 9.1%.
Above $1.70, the next major zone is around $1.90–$1.91. The chart specifically marks $1.9081, placing it roughly 22.3% above $1.56 and about 23.9% above the current $1.54 price.
The higher resistance band—the “red tape” referenced in the accompanying analysis—is positioned around $2.28, with the chart’s 0.236 Fibonacci level at $2.2832. A move from $1.54 to that level would equal approximately 48.3%.
Beyond that, the chart displays another major reference near $2.91, but that sits considerably above the immediate breakout structure.
The technical sequence displayed on the chart is therefore $1.56 → $1.70 → $1.90 → $2.28. These are chart-derived resistance levels rather than completed price moves. At the current $1.54 price, XRP is approaching the first level in that sequence after four previous tests of the same resistance area.
 Bitcoin
  Ethereum
  Tether
  BNB
BNB  XRP
XRP  USDC
USDC  Solana
  TRON
TRON  Zcash
Zcash  Figure Heloc