

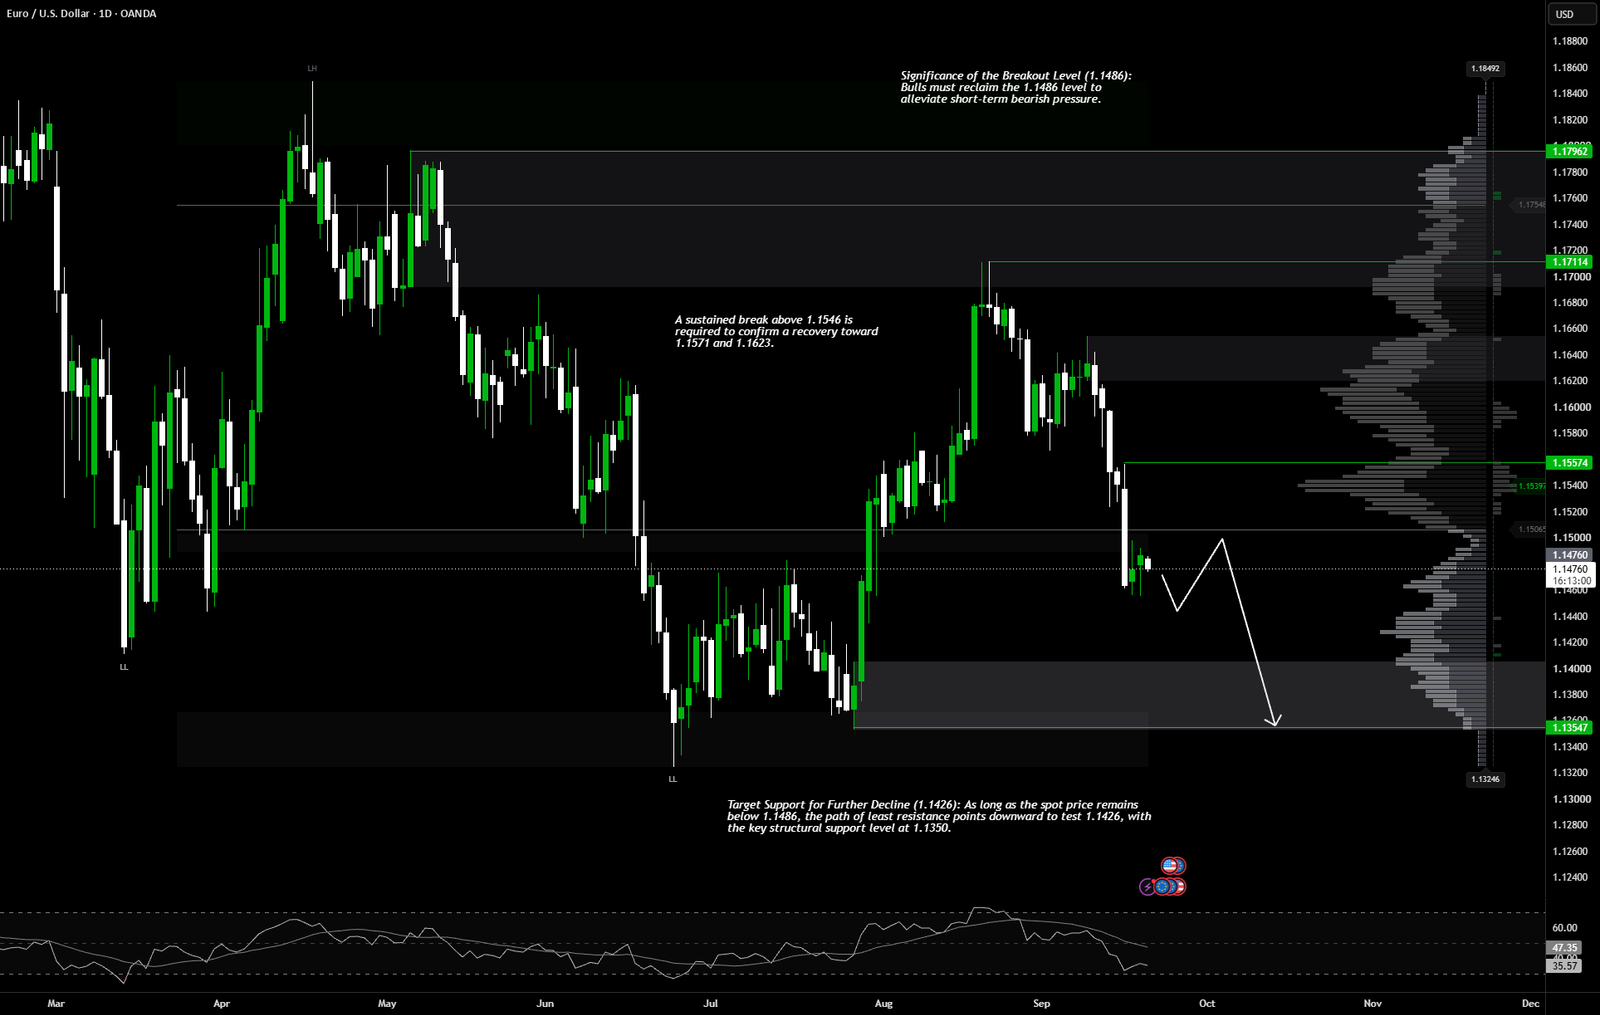

 EURUSD struggled to sustain a technical rebound from the mid-1.1400s (its lowest level since late July) and weakened toward the 1.1475 area at the start of the new trading week on Monday, September 21, 2026.
The Euro’s weakness was driven by the escalating hybrid war waged by Russia against NATO member states, combined with the strengthening of the US Dollar (USD) as a safe-haven asset following Houthi missile strikes on Riyadh, the capital of Saudi Arabia.
——————————————————————————————————————
✅ NATO-Russia Hybrid War & Christine Lagarde’s Speech Today
Two key factors are overshadowing the Euro’s outlook:
– ⚡Emmanuel Macron’s Warning on Russian Hybrid Threats: French President Emmanuel Macron and senior European officials have warned of increasing Russian cyber operations, sabotage, drone activity, and missile attacks targeting NATO nations that support Ukraine.
– ⚡ECB Tightening Speculation & Christine Lagarde’s Speech: The ECB has warned that inflationary pressures in the Eurozone are proving more persistent than anticipated. This situation increases the likelihood of a benchmark interest rate hike at the ECB’s October meeting. ECB President Christine Lagarde is scheduled to deliver a speech tonight to provide forward guidance on future monetary policy.
——————————————————————————————————————
✅ Price Action Analysis (Daily Timeframe)
The D1 structure confirms a continuing bearish macro structure, characterized by the formation of lower highs.
Following a recovery rally from the key “Lower Low” (LL) floor near the 1.13547 green line, EUR/USD surged to a peak of 1.17114. However, this peak failed to break through the upper major supply zone (1.17962), resulting in the formation of a macro “Lower High” (LH).
At the 1.14748 price level, recent daily price action has been dominated by impulsive, large-bodied bearish (red) candles that broke through the horizontal support line at 1.15574. The price is currently consolidating just above the local Demand Zone / SBR area in the 1.14400 – 1.14600 range.
✅ Key Zones:
– ⚡Resistance / Supply Zone (SBR): The range around the green line at 1.15574 (SBR area & nearest local resistance) and the green lines at 1.17114 – 1.17962 (top gray box / Major Supply Zone).
– ⚡Support / Demand Zone: The range of 1.14400 – 1.14600 (middle gray box / local Demand Zone) and the green line at 1.13547 (bottom gray box / Major Demand Zone / Structural Low).
——————————————————————————————————————
✅ Elliott Wave Analysis
Mapping the wave cycle movements on the Daily timeframe:
– ⚡Wave Structure:
The rise from the 1.13547 low to the 1.17114 high is interpreted as the formation of a corrective Wave B (or a macro Wave 2).
– ⚡Current Status:
The impulsive decline from the 1.17114 high—which broke the 1.15574 level and has now reached 1.14748—confirms the unfolding of an impulsive bearish Wave C (or macro Wave 3).
– ⚡Projection:
Price action is projected to complete this impulsive Wave C push by breaking through the local floor at 1.14400 and traversing the LVN zone, aiming for a full test of the Major Demand Zone stronghold around the 1.13547 green line.
 Bitcoin
  Ethereum
  Tether
  BNB
BNB  XRP
XRP  USDC
USDC  Solana
  TRON
TRON  Figure Heloc
  Zcash
Zcash 