

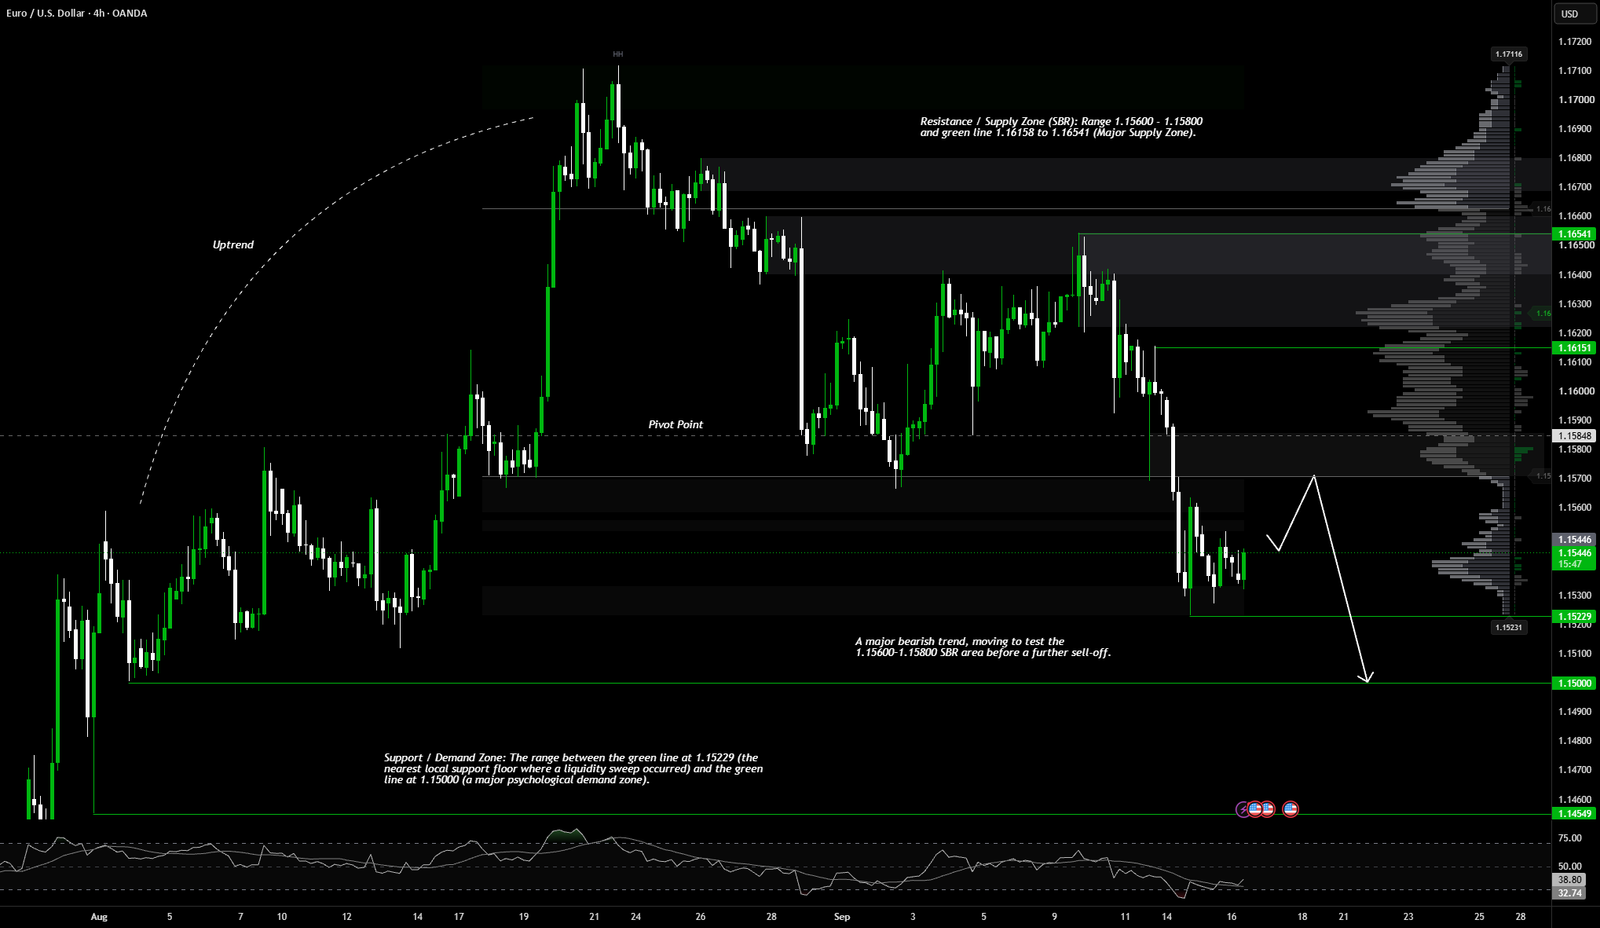
 XAUUSD maintained a negative bias for five consecutive sessions and consolidated in the 1.1530–1.1535 range throughout the Asian trading session on Wednesday, September 16, 2026.
—————————————————————————————————————–
✅ US Monetary & Bond Markets: Fed Rate Hike Expectations (+25 bps) & Record US 10-Year Yields (April 2007)
Bond market dynamics and US monetary policy expectations are cementing the Greenback’s advantage:
– ⚡Fed Interest Rate Announcement Tonight (+25 bps): The Federal Open Market Committee (FOMC) concludes its two-day policy meeting tonight (early Thursday morning WIB). The market has fully priced in the probability of the Fed raising the benchmark interest rate by 25 basis points (bps).
– ⚡US 10-Year Yield Surge to April 2007 Highs: A surge in public and corporate borrowing, combined with the threat of exogenous inflation driven by soaring crude oil prices (hitting new peaks since May 20), has propelled the benchmark US 10-year government bond yield to its highest level since April 2007.
– ⚡Hawkish ECB Stance Limits Downside: The Euro’s downside is being slightly cushioned by prospects of further European Central Bank (ECB) tightening following last week’s +25 bps rate hike; this has prevented the Euro from plummeting uncontrollably ahead of the Fed’s decision.
—————————————————————————————————————–
✅ Price Action Analysis (H4 Timeframe)
The H4 structure confirms a continuation of the bearish structure/retest phase.
After facing sharp rejection (bearish rejection) from the “Lower High” peak at the 1.16541 green line, EUR/USD slid downward, breaking through several minor support levels before establishing a temporary bottom near the 1.15229 green line. At the 1.15442 price level, the most recent H4 candle shows minor buying rejection (long lower wick), attempting to bounce the price off the 1.15229 floor.
This current green candle is part of a relief rally phase (a temporary upward correction) aimed at testing the SBR area within the 1.15600–1.15700 range.
—————————————————————————————————————–
✅ Key Zones:
– ⚡Resistance / Supply Zone (SBR): The 1.15600–1.15800 range (middle gray box / nearest SBR & HVN area) and the green lines from 1.16158 to 1.16541 (upper gray box / Major Supply Zone).
– ⚡Support / Demand Zone: The green line at 1.15229 (nearest local support floor where a liquidity sweep occurred) and the green line at 1.15000 (psychological Major Demand Zone stronghold).
—————————————————————————————————————–
✅ Elliott Wave Analysis
Mapping the wave cycle movements on the H4 timeframe:
– ⚡Wave Structure:
The sharp decline from the major peak toward the 1.15700 area is calculated as Sub-Wave A (or Wave 1). The upward bounce that stalled at the 1.16541 green line is identified as the formation of Sub-Wave B (a micro zigzag correction).
– ⚡Current Status:
The drop from 1.16541 to 1.15229 is calculated as part of the Sub-Wave C expansion (or micro Wave 3). The current upward bounce from 1.15229 to 1.15442 represents the formation of a minor corrective sub-wave (relief rally) to retest the SBR area.
– ⚡Projection:
The direction of price movement is projected to complete this corrective rebound by testing the SBR/HVN area in the 1.15600–1.15800 range, before reversing course to slide back down, breaking the green line at 1.15229 and targeting the Major Demand level at 1.15000.
 Bitcoin
  Ethereum
  Tether
  BNB
BNB  XRP
XRP  USDC
USDC  Solana
  TRON
TRON  Figure Heloc
  Zcash
Zcash 