

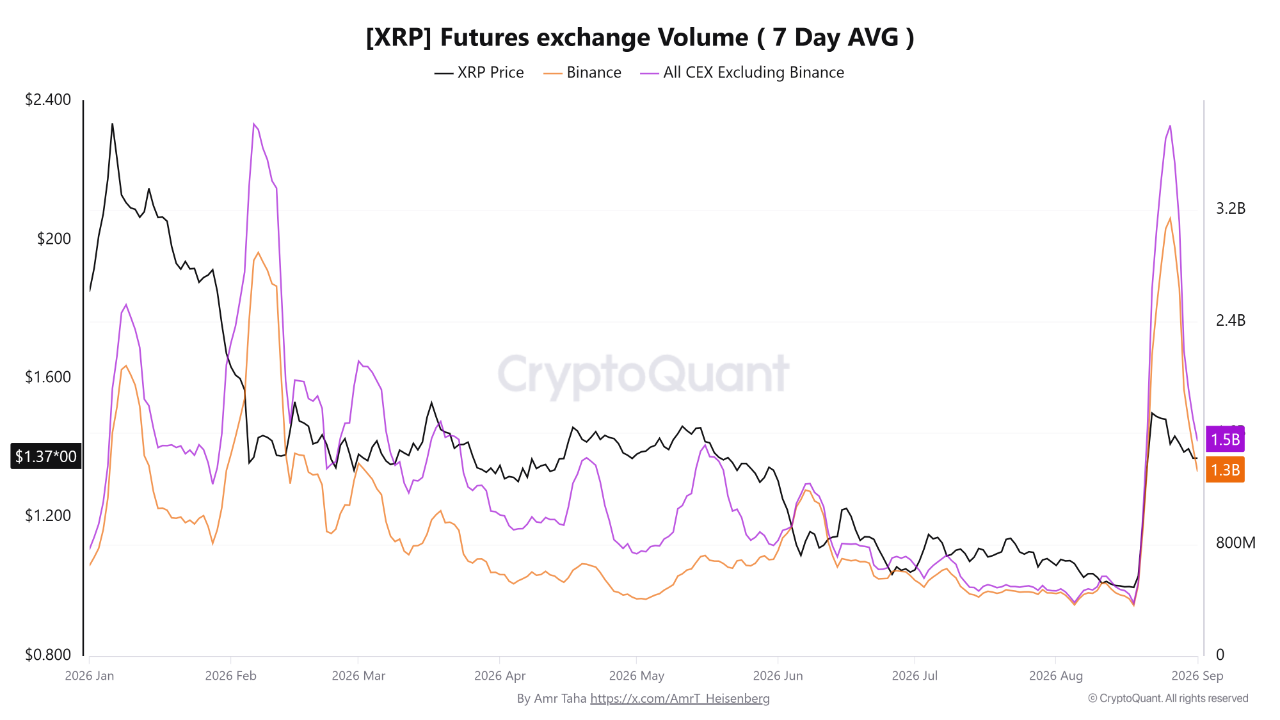
XRP futures trading activity has witnessed a sudden crash as the cryptocurrency pulls back from the $1.70 high it reached two weeks ago.
Recent market data shows that traders have started cutting their exposure to leveraged positions, causing futures volume to drop significantly while XRP’s price has held up relatively well.
On Aug. 26, 2026, the 7-day average futures volume across Binance and other centralized exchanges reached $6.94 billion. Binance accounted for $3.14 billion, while exchanges outside Binance recorded $3.80 billion.
The combined figure stood about 4.2% above the previous 2026 peak of $6.66 billion recorded on Feb. 6. Binance’s activity was especially strong, with its volume coming in 10.6% above its February high.
At the same time, futures volume outside Binance came close to its earlier peak. This showed that XRP futures trading reached its highest level of the year following the price spike that began two weeks ago.
Nearly $4.1 Billion in XRP Futures Trading Volume Disappears
However, the market changed over the next six days. By Sept. 1, 2026, Binance’s 7-day average futures volume had fallen to $1.32 billion, while exchanges outside Binance recorded $1.54 billion. Combined, futures activity across both groups stood at just $2.86 billion.
This figure represents a 58.8% decline from the $6.94 billion peak recorded on Aug. 26. Binance’s volume fell by 58.0%, while activity across other centralized exchanges dropped by 59.5%.
The similar size of the declines across both groups suggests that the slowdown has affected the broader XRP futures trading market instead of a single exchange.
In less than a week, nearly $4.1 billion in 7-day average futures volume disappeared. Despite that major drop in futures activity, XRP’s price declined by only about 5% over the same period.
XRP Holds Above Important Support
Currently, XRP trades at $1.3173, down 2.52% for the day. After its August rally from around $1.00 to $1.70, XRP has formed a descending triangle. The pattern comes on the back of a sudden correction after the strong upsurge.
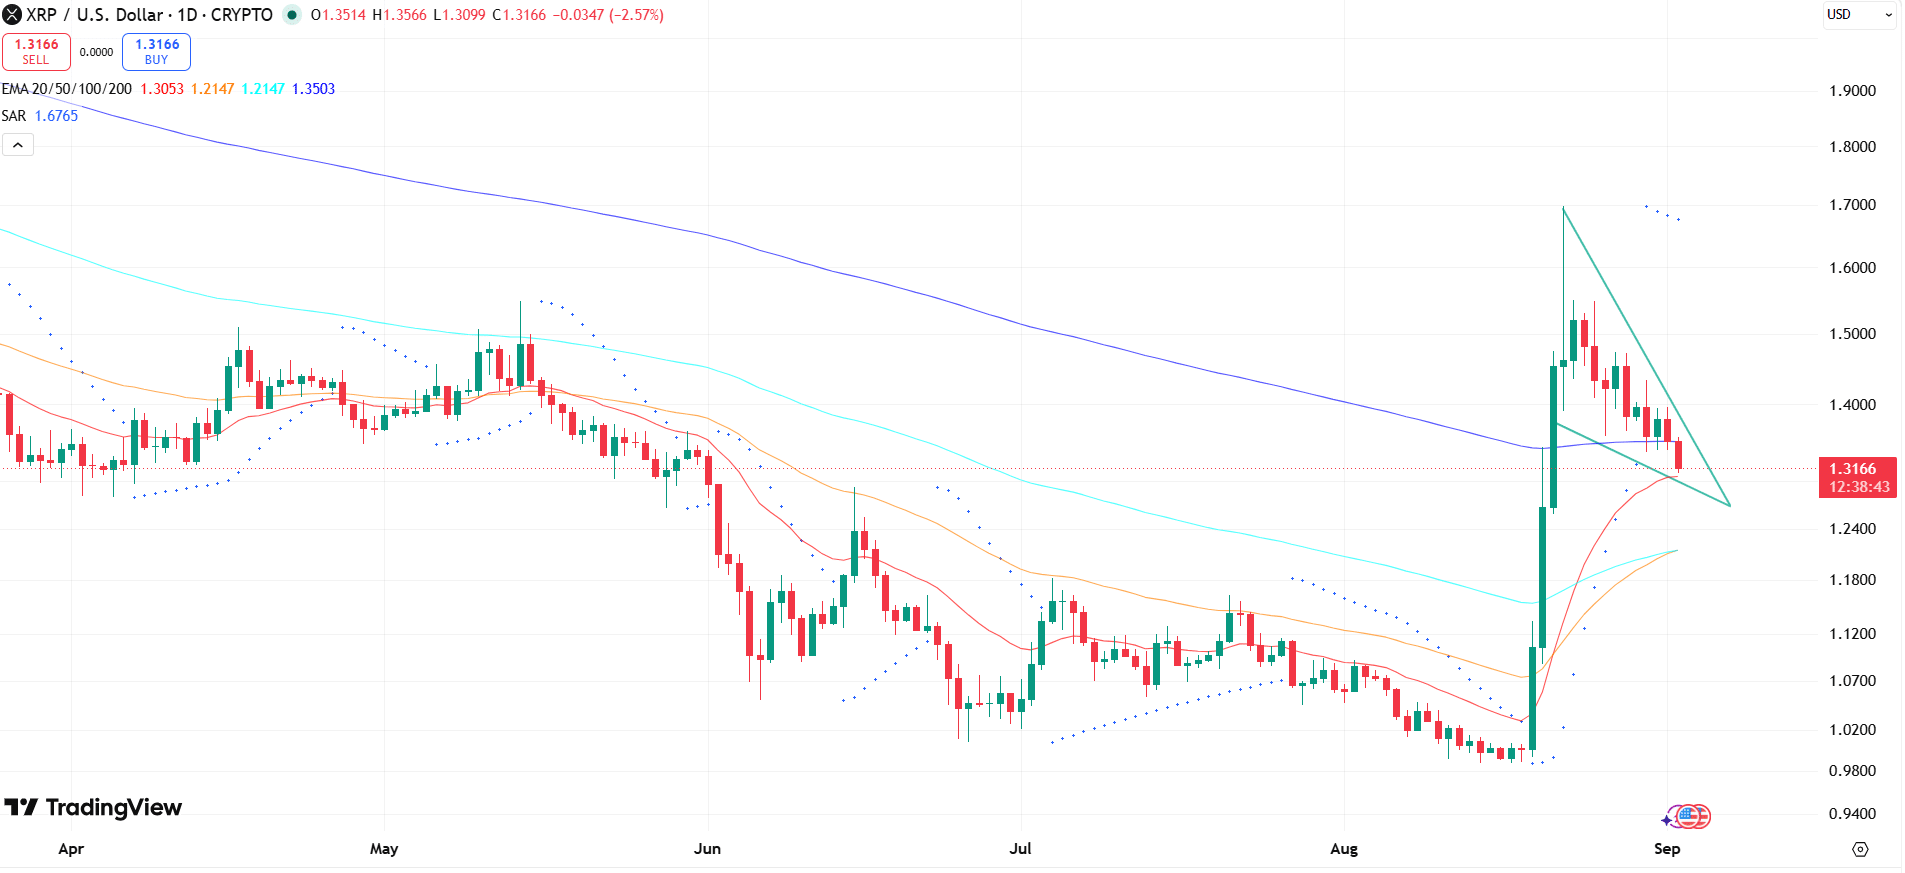
The $1.35-$1.38 range remains the key demand area, with about 3.2 billion XRP previously traded around this zone. A close below $1.35 could increase the chances of a move toward $1.20.
For the bulls, XRP needs to first reclaim $1.55 to put $1.68 back in focus. A break above $1.68 could then bring $1.86 into play. If XRP confirms a move above $1.86, the next targets would be $2.00 and $2.19.
XRP still trades above its 20-day EMA at $1.3053 and 50-day EMA at $1.2147. However, the Parabolic SAR remains at $1.6765, above the current market price. This indicator suggests that sellers still have the upper hand in the short term.
At the same time, demand from US spot XRP ETFs remains a positive factor. These products recorded $110.49 million in weekly inflows through Aug. 28, confirming continued institutional interest in XRP despite the recent price decline.
The Federal Reserve’s September meeting could also become an important catalyst for XRP and the wider crypto market. For now, the sharp fall in futures volume does not appear to have caused a similar breakdown in price.
DisClamier: This content is informational and should not be considered financial advice. The views expressed in this article may include the author’s personal opinions and do not reflect The Crypto Basic opinion. Readers are encouraged to do thorough research before making any investment decisions. The Crypto Basic is not responsible for any financial losses.
 Bitcoin
  Ethereum
  Tether
  BNB
BNB  XRP
XRP  USDC
USDC  Solana
  TRON
TRON  Zcash
Zcash  Figure Heloc