

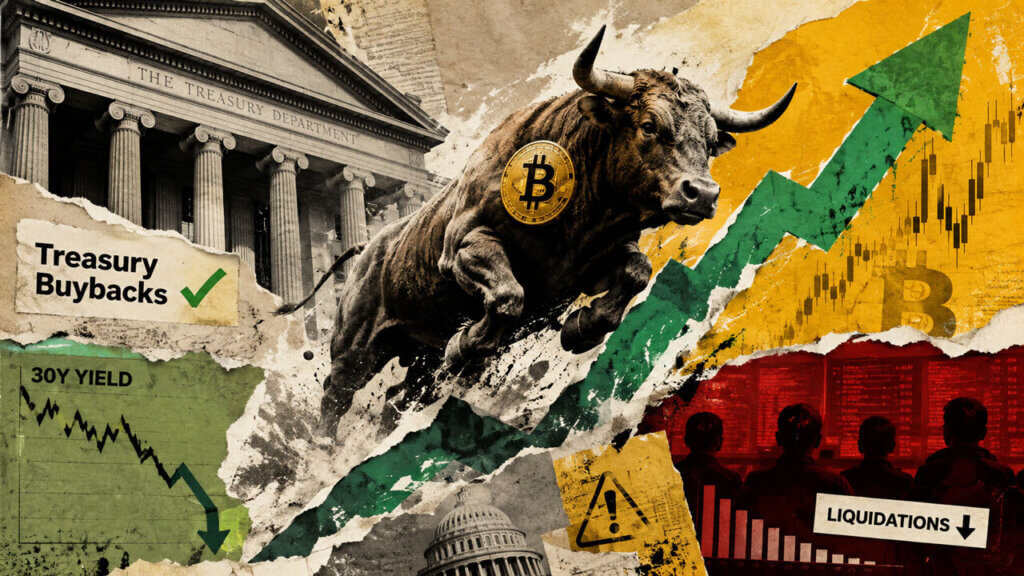
Bitcoin ran from around $64,100 to nearly $70,000 within hours on Aug. 19, once the US Treasury unexpectedly doubled its planned buybacks of long-dated government debt. The move pushed bond yields lower and forced roughly $1.4 billion of crypto short positions out of the market in just four hours.
Treasury said it would raise the maximum size of its liquidity-support buybacks for 10-to-20-year and 20-to-30-year securities from $2 billion to at least $4 billion per operation, running from Sept. 9 through Nov. 4.
The stated purpose was improving liquidity in longer-dated Treasuries.
| Market signal | Before / prior level | After Treasury announcement | Why it matters |
|---|---|---|---|
| Bitcoin | ~$64,100 | Nearly $70,000 | Shows the speed of the macro-driven BTC repricing |
| 30-year Treasury yield | ~5.34% peak | ~5.19% | Long-end relief was the trigger for the risk rally |
| 10-year Treasury yield | Near recent highs | ~4.65% | Lower discount rates reduce pressure on risk assets |
| Crypto short liquidations | — | ~$1.4B in four hours | Explains why the BTC move accelerated so violently |
| Buyback operation cap | $2B | At least $4B | Treasury signaled stronger long-end liquidity support |
Why this falls short of yield-curve control
Traders started calling the move implicit yield-curve control within hours, and the framing is understandable given how fast long yields dropped. The 30-year fell from Tuesday’s peak near 5.34% toward 5.19%, while the 10-year slid toward 4.65%.
Formal yield-curve control means a central bank commits to defending a specific yield, buying whatever it takes to hold a target. Treasury made no such commitment, and fixed-income strategists pushed back quickly.
TCW’s Jamie Patton said claims that Treasury had effectively capped yields go too far, since the forces pushing long rates higher are global and no single buyer can simply purchase them away.
The new $4 billion buyback ceiling is small compared with a Treasury market worth more than $32 trillion, with roughly $5.5 trillion of 20- and 30-year debt outstanding on its own.
The Fed minutes complicate the relief
The dollar index dropped 0.75% to 98.90, gold jumped, stocks rose, and Bitcoin gained alongside them, registering an intraday high of $70,000.
Ethereum climbed up to 21.7% to register an intraday high at $2,333.65. Falling long-term yields had been competing with Bitcoin and other risk assets for capital, and that competition eased the moment the Treasury signaled it would buy more.
Minutes from the Fed’s July meeting, released the same day, ran counter to the idea that financial conditions are easing. Several participants said they favored a 25-basis-point hike at that meeting, and many thought additional tightening would probably be necessary if inflation failed to come down.
Some officials questioned whether financial conditions were even restrictive enough to bring inflation back to 2%.
| Policy signal | Direction for Bitcoin | Key detail | Market implication |
|---|---|---|---|
| Treasury buybacks expanded | Bullish | Long-end liquidity support increased from $2B to at least $4B per operation | Lower yields eased pressure on BTC and risk assets |
| 30-year yield fell | Bullish | Dropped toward ~5.19% | Reduced competition from long bonds |
| Dollar weakened | Bullish | DXY down 0.75% to 98.90 | Supported hard assets and crypto |
| Fed minutes stayed hawkish | Bearish | Several officials favored a 25 bp hike | Undercuts the “macro easing” narrative |
| Vote split was 9–3 | Bearish | Three officials dissented in favor of hiking | Shows tightening pressure inside the Fed |
| Inflation risks skewed upward | Bearish | Officials worried inflation could persist | Keeps future rate hikes on the table |
The vote to hold rates at 3.50% to 3.75% passed 9 to 3, with Hammack, Kashkari and Logan dissenting in favor of a hike. Inflation risks were described as skewed upward.
The minutes drew little immediate market reaction, mostly because Treasury’s announcement had already dominated the day’s trading. Rate markets kept pricing better-than-even odds of a hike by October and a much higher probability by December.
Bitcoin hit a wall where the data said it would
Bitcoin fought around its 200-day moving average at $69,031, trading above it as it neared the daily close.
That level sits almost where Glassnode’s on-chain models placed the test, with a recent report putting Bitcoin’s short-term-holder cost basis at $68,500 and its broader true market mean at $75,800.
The Aug. 20 spike carried price directly into the zone where recent buyers break even, but nowhere near the level where the wider active investor base does.
A $16 billion 20-year Treasury auction later on Aug. 20 required a 5.204% yield, slightly above where yields sat right before bidding opened, and it reversed part of the morning’s Treasury gains.
Real buyers still wanted extra to hold long-duration government debt, even after Treasury said it would become a bigger buyer itself. September adds more strain on the same front, with roughly $200 billion of corporate bond issuance expected and heavy AI-related borrowing competing for the same investor capital.
Whether the squeeze becomes something more
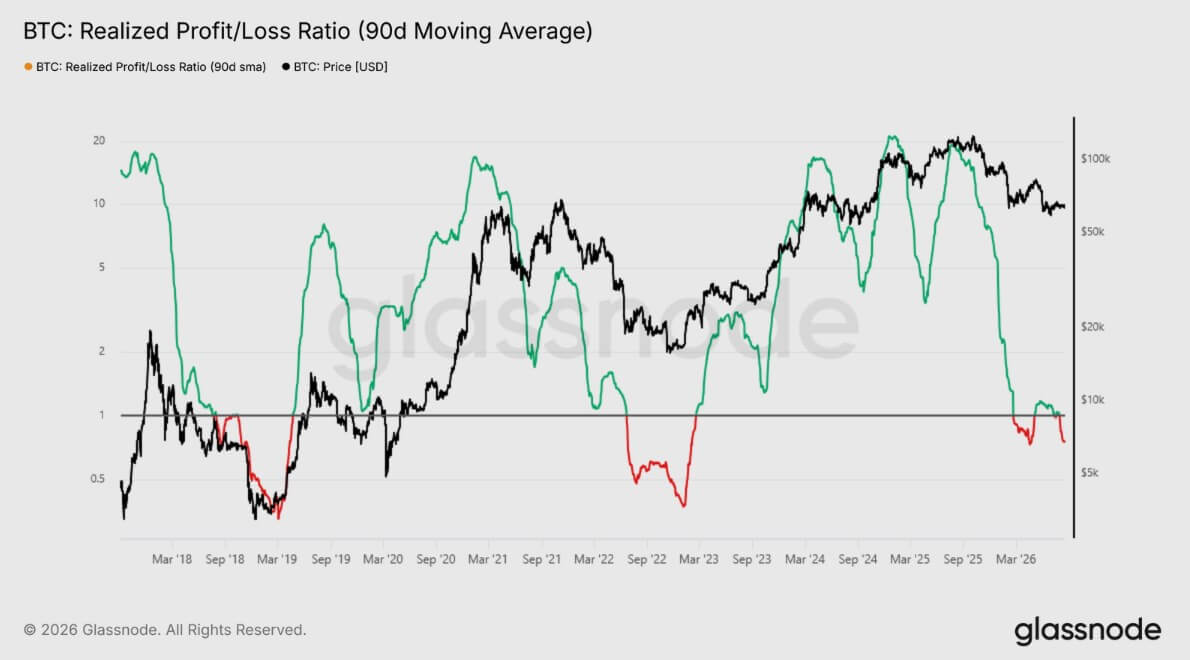
Glassnode’s Realized Profit/Loss Ratio, a measure of realized gains against realized losses, sits at 0.75. That is above the sub-0.5 zone that has historically marked seller exhaustion, but well below the 2.0 level Glassnode treats as confirmation of a genuine recovery.
Perpetual futures demand has turned positive again, but Coinbase’s premium, the gauge Glassnode uses to track US spot demand specifically, has stayed negative through the entire consolidation.
US-traded Bitcoin spot ETF flows have only stabilized from a trough of roughly 5,000 BTC in daily outflows, moving marginally positive again after a brief return to outflows. Glassnode says that until yields ease further and the profit/loss ratio climbs toward 2, any recovery is best treated as a local rally within an unfinished bottoming process.
| Signal to watch | Bullish confirmation | Bearish warning | Why it matters |
|---|---|---|---|
| BTC 200-day moving average | Holds above $69,031 | Falls back below $69,031 | Separates breakout from failed squeeze |
| Short-term-holder cost basis | Holds above ~$68,500 | Loses ~$68,500 | Shows whether recent buyers are back in profit |
| True Market Mean | Move toward ~$75,800 | Fails far below it | Marks whether broader active investors are recovering |
| Realized Profit/Loss Ratio | Climbs toward 2.0 | Stays near 0.75 or falls below 0.5 | Confirms whether recovery is genuine or still fragile |
| Coinbase premium | Turns positive | Remains negative | Measures whether US spot demand is following the rally |
| Spot ETF flows | Sustained inflows for weeks | Flows stall or return negative | Shows whether forced buying is being replaced by real demand |
| Long Treasury yields | Stay suppressed | Resume climbing | Determines whether the macro setup still supports BTC |
The bull case has Bitcoin holding above $69,031. Coinbase’s premium turns positive, and ETF inflows run consistently for weeks, well past the single positive print Glassnode logged this week.
That combination would suggest real spot demand has stepped in behind the short-covering, giving Glassnode’s Realized Profit/Loss Ratio room to climb toward the 2.0 level the firm treats as genuine recovery confirmation.
The bear case has long yields resuming their climb as September’s heavy bond supply and persistent inflation worries overwhelm buybacks too small to offset them.
The 20-year auction already hinted at that pattern on the very day Treasury made its announcement. Bitcoin’s entire rally was built on the opposite move in financial conditions.
A return to climbing yields would carry more weight than any other single catalyst, pulling price back below both the 200-day average and Glassnode’s short-term-holder cost basis at $68,500.
Short liquidations explain Bitcoin’s fast move on Aug. 20, but whether price holds now depends on spot buyers showing up where forced sellers just left.
 Bitcoin
  Ethereum
  Tether
  BNB
BNB  XRP
XRP  USDC
USDC  Solana
  TRON
TRON  Figure Heloc
  Zcash
Zcash 