Chainlink has seen long contracts pile up on Binance during the past day, which may lead toward a top for the cryptocurrency.
Chainlink Funding Rate On Binance Has Turned Highly Positive
According to data from the on-chain analytics firm Santiment, the Chainlink funding rate on Binance has now reached the highest level in about four weeks. The “funding rate” refers to the periodic fee that derivative traders on any given platform are exchanging with each other right now.
When the value of this metric is positive, it means that the long holders are currently paying a fee to the short investors in order to hold onto their positions. Such a trend suggests a bullish mentality is dominant on the platform.
On the other hand, negative values imply a bearish sentiment is shared by most LINK traders on the exchange as the shorts outweigh the longs.
Now, here is a chart that shows the trend in the Chainlink funding rate on cryptocurrency exchange Binance over the last few months:
The value of the metric appears to have seen a large spike recently | Source: Santiment on X
As displayed in the above graph, the Chainlink funding rate on Binance has assumed significantly positive values following the asset’s surge beyond the $16 mark.
Longs currently outweigh the shorts by the highest ratio since November 11th, when the cryptocurrency’s price set its then-yearly high, which the coin has now surpassed.
Historically, longs piling up on the derivatives market have often been negative for the price. This is because a mass liquidation event called a “squeeze” is usually more likely to affect the side with the most positions.
In a squeeze, a sudden swing in the price triggers a large amount of liquidations, which only feed into the swing further and end up leading to a cascade of more liquidations.
As the Chainlink funding rate is significantly positive, a long squeeze could be more likely to happen than a short squeeze. Last month, the asset hit its local top in these conditions, so the same might also repeat this time.
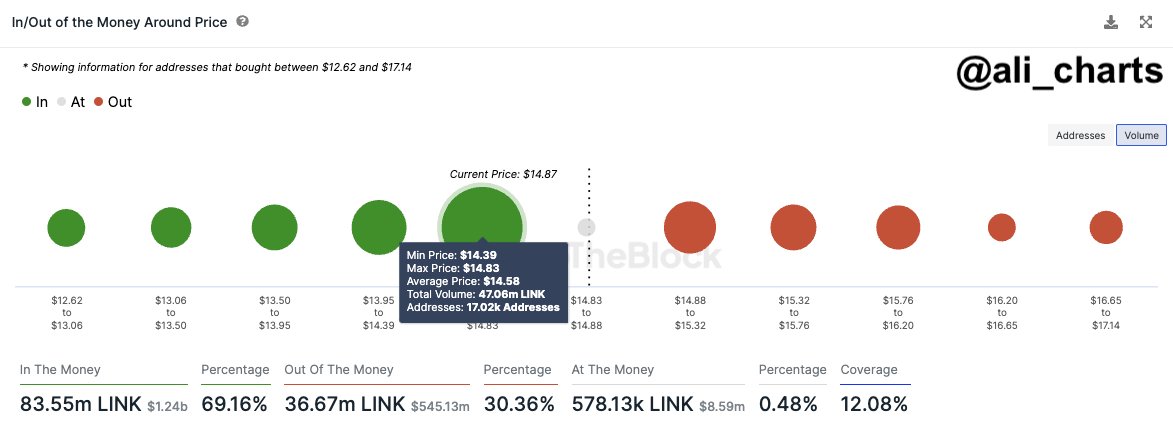
If LINK does observe a drawdown shortly, though, the decline may not be too extended. This is because there appears to be some strong on-chain support present between the $14.4 and $14.8, as analyst Ali pointed out in an X post yesterday.
Looks like LINK has little resistance ahead | Source: @ali_charts on X
In on-chain analysis, levels are defined as resistance and support based on the total number of investors who acquired their coins at said levels. From the chart, it’s visible that 17,000 addresses have their cost basis inside the $14.4 to $14.8 range, which means it’s possibly a zone of strong support.
On the contrary, the levels above the current one are thin with investors, meaning that they shouldn’t pose too much resistance should the rally continue.
“As $LINK has regained the $16 threshold, watch if a bit of FOMO forms a local top, or if prices continue surging toward $20 with little resistance,” notes Santiment.
LINK Price
LINK had earlier broken past the $17 mark, but the asset has since seen some pullback as it’s now trading under the level once more.
LINK has shot up during the past day | Source: LINKUSD on TradingView
Featured image from iStock.com, charts from TradingView.com, IntoTheBlock.com, Santiment.net


 Bitcoin
  Ethereum
  XRP
XRP  Tether
  Solana
  USDC
USDC  Lido Staked Ether
  TRON
TRON  Dogecoin