

A report suggests that Bitcoin’s correlation with other risk assets could be relevant going forward into the next year.
Bitcoin Moved Tightly With US Stock Market During Last Week’s Volatility
According to the latest weekly report from Arcane Research, signals from the Federal Reserve could be something to pay attention to in 2023 as well. Two assets are said to be “correlated” when their prices move in tandem with each other. Bitcoin has been showing a correlation with the US stock market for a while now, and it seems like this trend hasn’t changed this week either.
The below chart shows how BTC, Nasdaq, S&P 500, Gold, and DXY have changed in value during the recent volatile events:
Looks like only Gold saw positive returns between 13 and 17 December | Source: Arcane Research's Ahead of the Curve - December 20
As the above graph displays, all the risk assets observed a rise in the buildup to and after the CPI release, which turned out to be more optimistic than expected, with Bitcoin seeing an especially sharp uptrend as it hit a peak of $18,400. However, as the FOMC meeting took place, tides started to shift against the prices of these assets. Then finally, on Friday, both US equities and BTC observed a selloff as their values rapidly plunged.
This means that throughout these macro events, BTC remained correlated with Nasdaq and S&P 500. “In sum, this correlated response to important macro developments suggests that correlations with other risk assets will remain relevant in BTC’s price discovery onwards,” explains the report.
The recent high degree of connection between these assets can also be seen in more concrete terms through the “correlation” indicator, which measures in numbers whether Bitcoin and another asset are tied or not right now.
When the value of this metric is greater than zero, it means BTC is positively correlated with the commodity as its price is moving in the same direction as the asset. On the other hand, a negative correlation implies BTC is responding to changes in the other asset’s value by moving oppositely to it. Here is a chart that shows Bitcoin’s 30-day correlations with other assets since October:
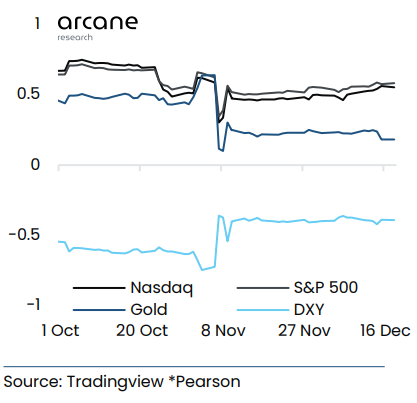
BTC seems to have been highly correlated with S&P 500 and Nasdaq | Source: Arcane Research's Ahead of the Curve - December 20
From the graph, it’s apparent that Bitcoin has had a positive correlation with US equities in recent months. The higher the value of the metric above zero, the more correlated the assets are. Thus, the current values suggest a decent degree of interconnection between the risk assets currently.
This correlation is likely to continue into the next year so macro events like signals from the Federal Reserve are something that investors should pay attention to, as the report notes.
BTC Price
At the time of writing, Bitcoin’s price floats around $16,800, down 5% in the last week.

BTC has mostly moved sideways recently | Source: BTCUSD on TradingView
Featured image from Kanchanara on Unsplash.com, charts from TradingView.com, Arcane Research
 Bitcoin
  Ethereum
  Tether
  BNB
BNB  USDC
USDC  XRP
XRP  Solana
  TRON
TRON  Figure Heloc
  Hyperliquid