

XRP was consolidating between $0.24 and $0.33 for the last one week. The altcoin registered an upside over the last 24 hours. XRP registered demand which caused the coin to witness recovery on its chart.
The cryptocurrency market also registered an overall rise in prices as buyers were slowly re-entering the market.
The broader market despite increase in price is still in a fragile, hence it is difficult to ascertain whether XRP will continue its bullish stride in the long term.
At the current moment, XRP has secured the support level of $0.30. As price of XRP has constantly seen downfalls, it is quite natural that the coin might continue to witness relief rallies.
These rallies however, are brief and fade out soon. If XRP doesn’t continue to form higher highs then bullish trend might not be able to sustain the bulls in the market.
The global cryptocurrency market cap today is $958 Billion with a positive increase of 0.1% in the last 24 hours.
XRP Price Analysis: Four Hour Chart
The altcoin touched yearly lows on it chart this month as the bloodbath continued to extend. At the time of writing, the coin was trading for $0.33. The price previously displayed consolidation as XRP traded between the $0.24 and $0.31 levels respectively.
Over the last 24 hours, the coin moved past the range and was priced at $0.33. The local support for the coin stood at $0.30 while the overhead resistance for XRP was at $0.38.
The $0.38 level has acted as stiff resistance as the coin barely managed to move above that aforementioned price level in weeks now. Volume of XRP traded rose significantly and the bar was in the red, this however, pointed towards bearishness in the market.
Technical Analysis
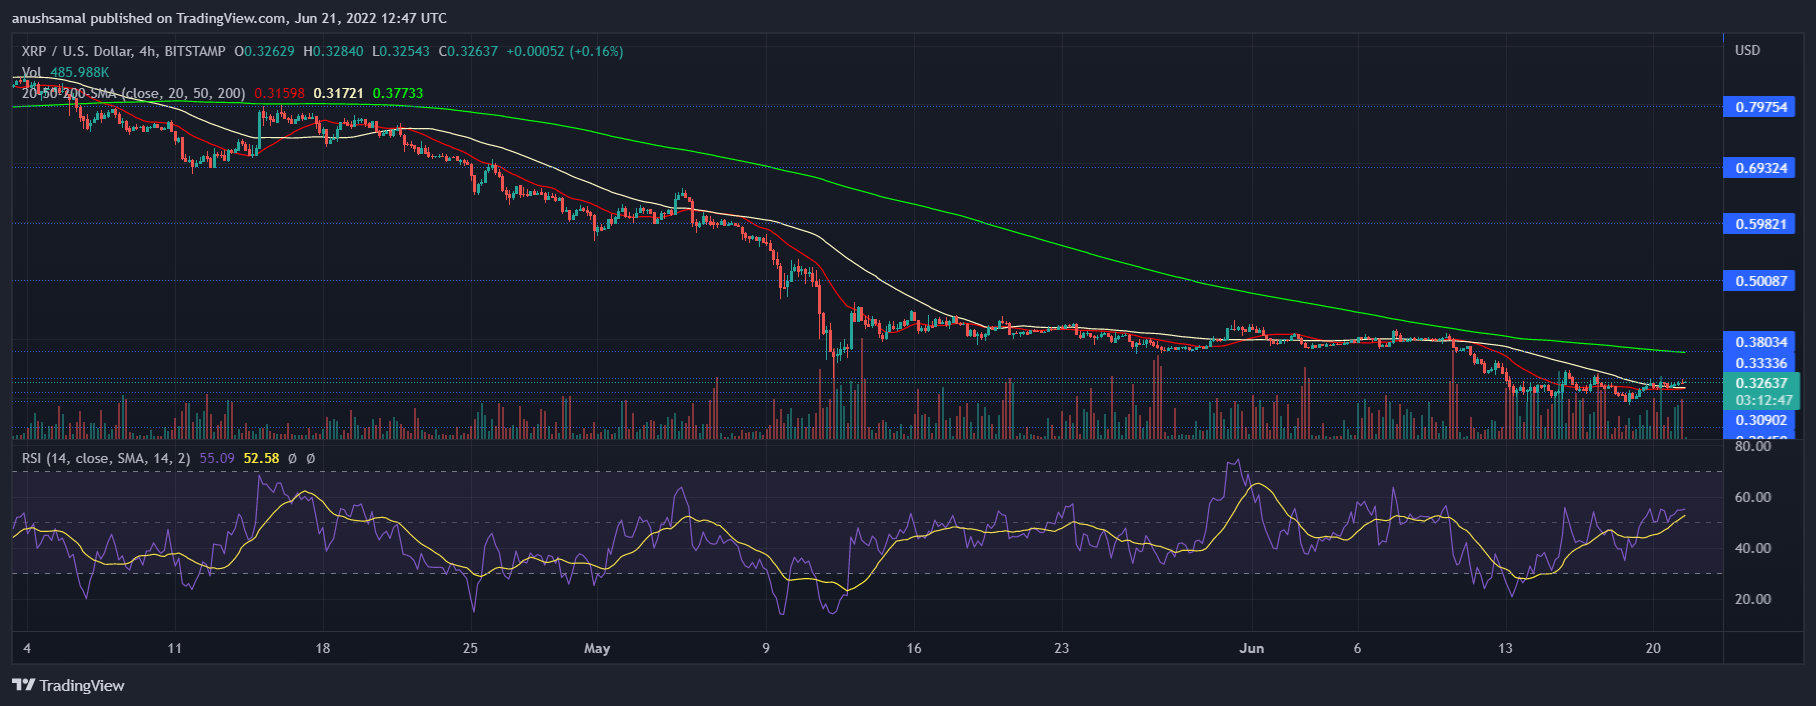
The coin flashed a considerable increase in buying strength, this has in return pushed the price north. The Relative Strength Index was seen above the 50-mark which is a sign of buying strength in the market. The technical outlook has painted a bullish picture but RSI over the last 48 hours, have seen dips which points towards fragile buying strength.
If XRP has to trade in the north, then the coin has to shoot above the $0.50 mark. For this however, the buying strength has to remain consistent. In accordance to the same, the price of XRP was above the 20-SMA, this meant that buyers were driving the price momentum in the market.
Related Reading | XRP Consolidates, Is It Going To Retrace Now?
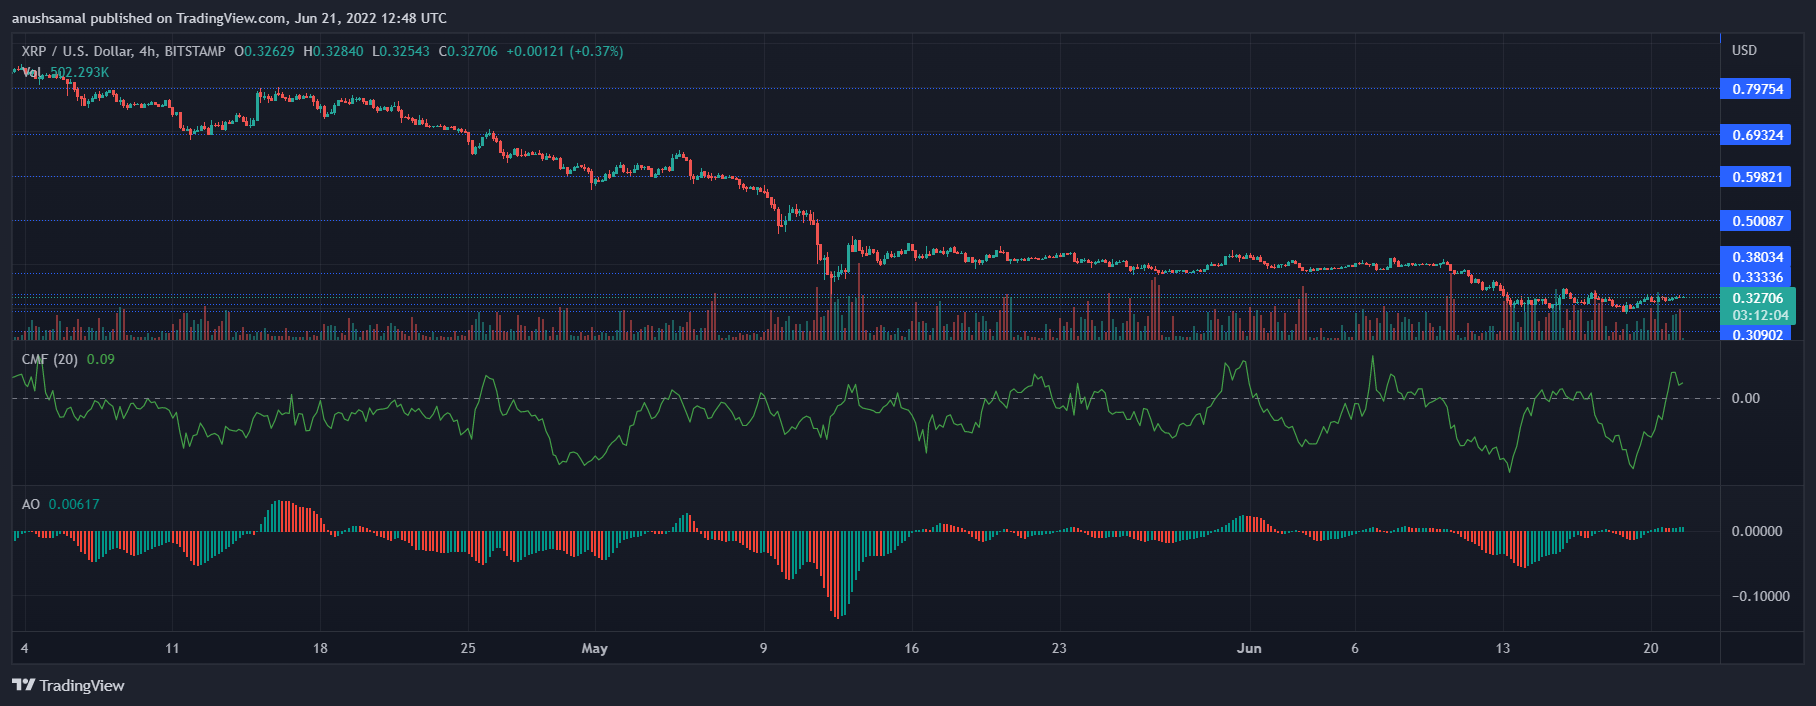
The Awesome Oscillator depicts the price direction and price reversal too. The indicator flashed green histograms which act as a buy signal. The effects of the buy signal reflected on the RSI as seen on the previous chart. Chaikin Money Flow also was positive on the smaller time frame.
This indicator points towards capital inflows and outflows. On the four hour chart, CMF showed increase in capital inflows and fall in capital outflows. Despite bullish signals on the charts, the altcoin was still fragile. Buying strength needs to remain stable and only then with considerable demand can the altcoin remain above the bearish zone.
Related Reading | Bitcoin Back At $21K After 75% Drop, Where Does It Go From Here?
Featured image from UnSplash, chart from TradingView.com
 Bitcoin
  Ethereum
  Tether
  BNB
BNB  USDC
USDC  XRP
XRP  Solana
  TRON
TRON  Figure Heloc
  Hyperliquid