

The Bitcoin Rainbow Chart dips into the ‘Accumulate’ zone following a miserable run of six consecutive weekly red candles. As of press time, Bitcoin (BTC) was trading at $31,368.20.
Since May 5, BTC has lost 21% in value, dropping from $39,600. Monday saw further sell pressure as bears pushed Bitcoin to $30,000 for the first time since July 2021.
With the Fear and Greed Index sinking to 10, deep within ‘extreme fear’ territory, many wonder whether it’s time to accumulate or liquidate.
On that, Crypto Rover tweeted to his 200,000+ Twitter followers that his financial success came about by accumulating Bitcoin during bear markets.
I became a millionaire due to accumulating in #Bitcoin bear markets.
Future millionaires are made in these challenging times. 🚀
— Crypto Rover (@rovercrc) May 8, 2022
However, markets cannot ignore the dire economic outlook and warning signs.
Bitcoin sell pressure mounting
Fears of a return to crypto winter are rising as prices continue to plunge. The weekend sell-off continued to May 9, with Bitcoin bulls unable to defend the $34,000 level.
Although myriad factors are in play, the most significant is the threat of inflation and how central banks are likely to accelerate aggressive rate increases to combat the problem.
Following the Fed’s 50 basis point hike of the interest rate last week, crypto markets reacted with an initial sharp drop, losing $132 billion in total market cap. Since then, a continuation downwards followed, albeit at a more measured pace than previously.
The current total crypto market cap is $1.466 trillion, which represents a 20% drop, over five days, from the local high.
Stay or go?
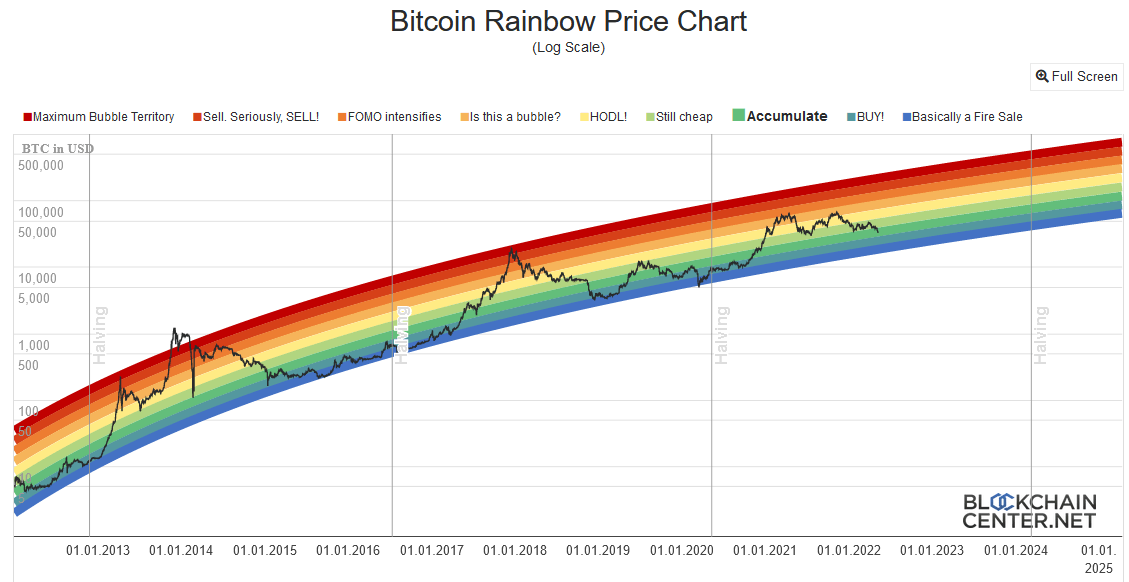
The Bitcoin Rainbow Price Chart shows the price of BTC on a log scale. The rainbow element represents an upper and lower band, with zones in between to signify nine different statuses ranging from ‘Maximum Bubble’ to ‘Fire Sale.’
Price action should be contained within the upper and lower bands of the rainbow. However, there have been two distinct instances where the price moved beyond the limits.
First, in November 2013, before returning below the upper band and then back above the upper limit again in December 2013. And another time in March 2020 (covid crash), where BTC dipped marginally below the lower band.
The expectations are that the Bitcoin price will stay within the bands. Considering its approximate position, the lower band, or worst-case scenario, would give a bottom of around $20,000 in the short term.
Blockchaincenter.net says the Rainbow Chart is a fun way of looking at price movements and should not be taken as investment advice.
Bill Noble, Chief Technical Analyst at Token Metrics, said, “don’t panic and puke,” adding that size positioning is key to tolerating the volatility on whether to accumulate or liquidate during these testing times.
Meanwhile, Unocoin co-founder Sathvik Vishwanath thinks medium and long-term hodlers should not concern themselves with short-term fluctuations.
 Bitcoin
  Ethereum
  Tether
  BNB
BNB  USDC
USDC  XRP
XRP  Solana
  TRON
TRON  Figure Heloc
  Hyperliquid