


In this article, we will explore the indicators behind the positioning of BTC investors and its psychological effect, the large increase in institutional activity, and the possible supply shortage on centralized exchanges.
97% of BTC investors are making money
The In/Out of the Money Around Price indicators show the distribution of addresses that have bought some Bitcoin around certain price ranges. Marked in green are those price ranges below the actual market price of Bitcoin, while the red area means those price ranges above market price. A bigger circle in a certain price range means that there is a bigger concentration of addresses that bought Bitcoin with an average price within that price range.
Following some of the options market terminology, if the current price of the asset is higher than the average cost of the tokens being held on those addresses, it is said that they are “In the Money.”
On the contrary, if the current price of the asset is less than the average cost of the assets being held, then those addresses are “Out of the Money.” Lastly, if the current price of the crypto asset is very close to the average price of the tokens being held, it is said that those addresses are “At the Money.”
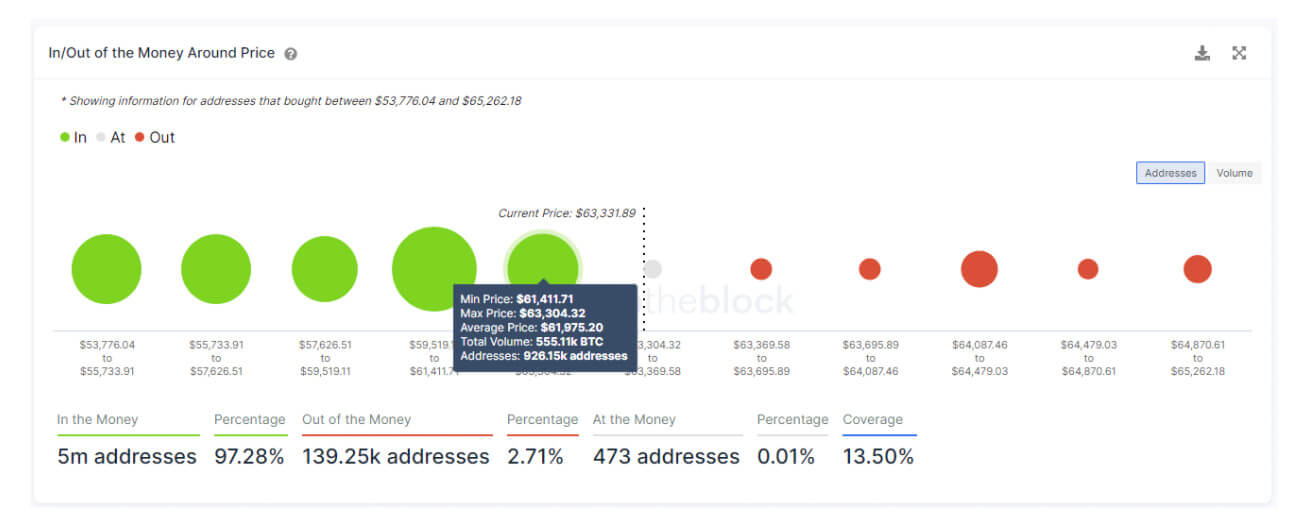
As the indicator shows, now that Bitcoin is just below all-time highs, 5 million of addresses (97.28% of the total) have an average buy price that is below the actual market price, so they are in profit. The total number of addresses is a good proxy of the amount of individual investors. Based on behavioral economics theory, this is a bullish sign since investors have the disposition to keep their winning investments by not selling, and cut the losing investments.
Furthermore, this indicator can be used to spot key support and resistance price levels, similarly to volume profiles, a popular indicator of technical analysis, but with on-chain data. A bigger circle would mean a large concentration of buyers around that price, and could act as a resistance in case that the price would drop.
A large concentration of investors (928k addresses) have bought in the range of $61,600 and $63,500, so that price range could work as a supporting price band given the high buying activity at those prices.
Institutional use of the BTC network keeps trending higher
The Average Transaction Size indicator shows the average daily amount in dollars that have been transacted in the whole Bitcoin blockchain. This is calculated by taking the value of all transactions divided by the number of transactions.
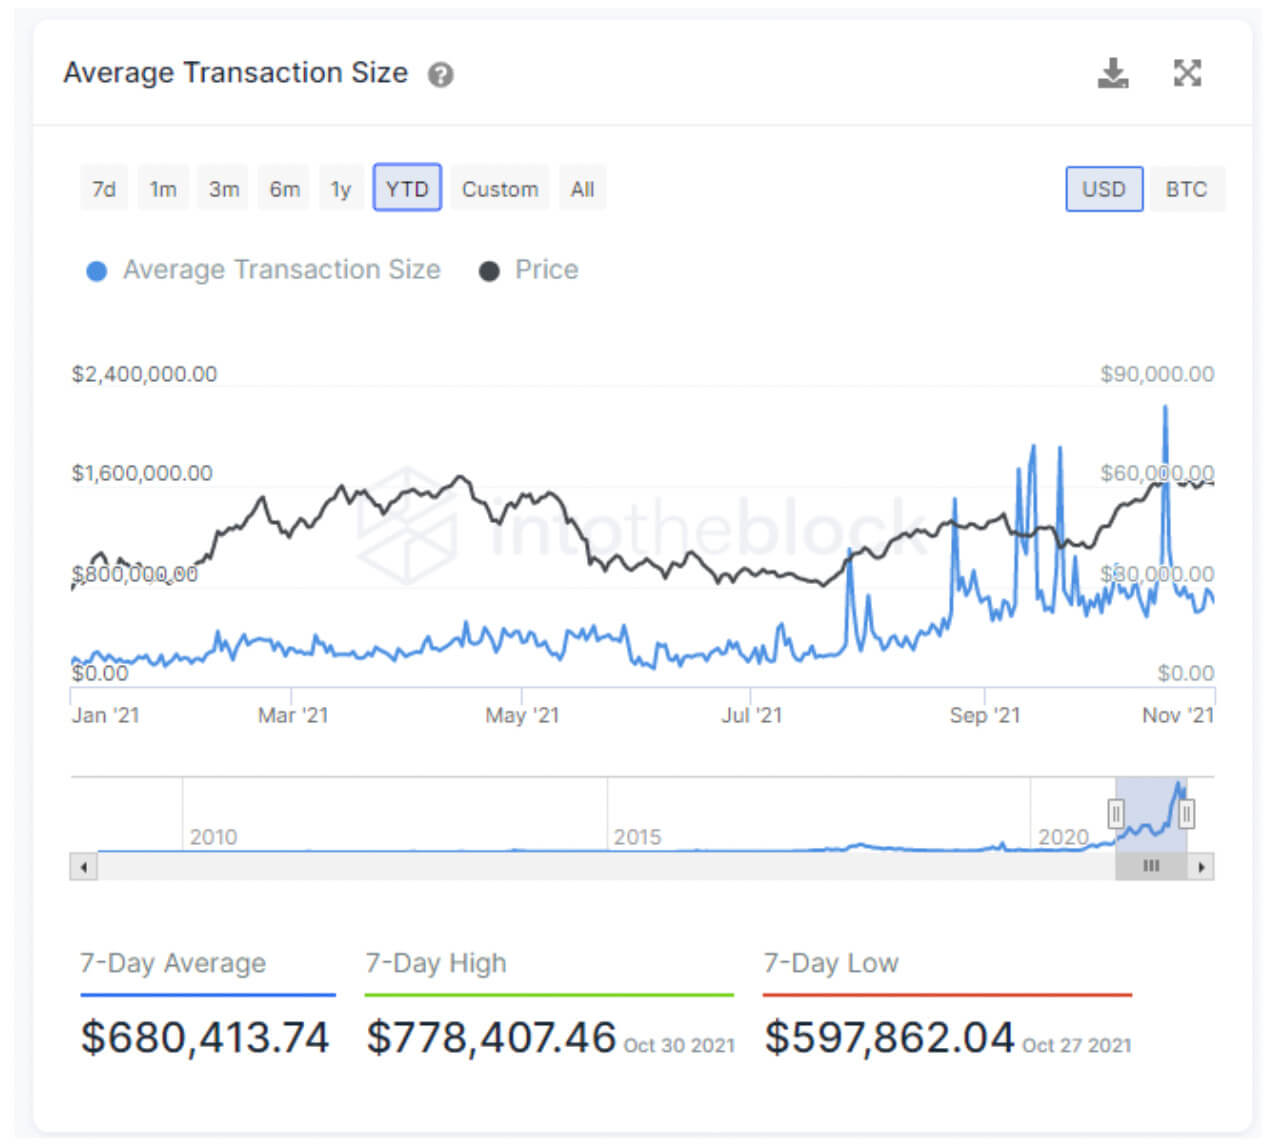
The fact that this indicator is at all-time highs and rising means that the average of Bitcoin transactions is six figures, which is a good hint that many of the transactions performed in the Bitcoin network are done by institutions. The first half of the year had an average transaction size that was fairly constant with figures around $250k-$350k, but since July this amount has at least doubled with averages of $550k-$650k and some single peaks of more than $2bn recently.
The fact of the growing interest of institutional investors seeking exposure to Bitcoin is a bullish sign for its price action due to its scarce nature. The recent news of ETFs successfully launching in US markets supports the thesis of this institutional activity growth.
Investors are buying way more BTC in centralized exchanges than selling it
The netflows indicator is calculated by summing all the inflow volume of Bitcoin entering in all exchange addresses and resting the outflow volume that comes out from all exchange addresses to users’ wallets. Net Flows are positive when more funds are entering than leaving exchanges. On the opposite side, net flows are negative when a greater volume is being withdrawn from exchanges.
A trend in positive netflows could be a sign of distribution between investors since there is a higher volume of coins entering the exchanges most likely to be sold. Conversely, trends in negative flows sign that investors have been buying coins and accumulating them by sending them to their own addresses instead of holding them in the centralized exchanges addresses.
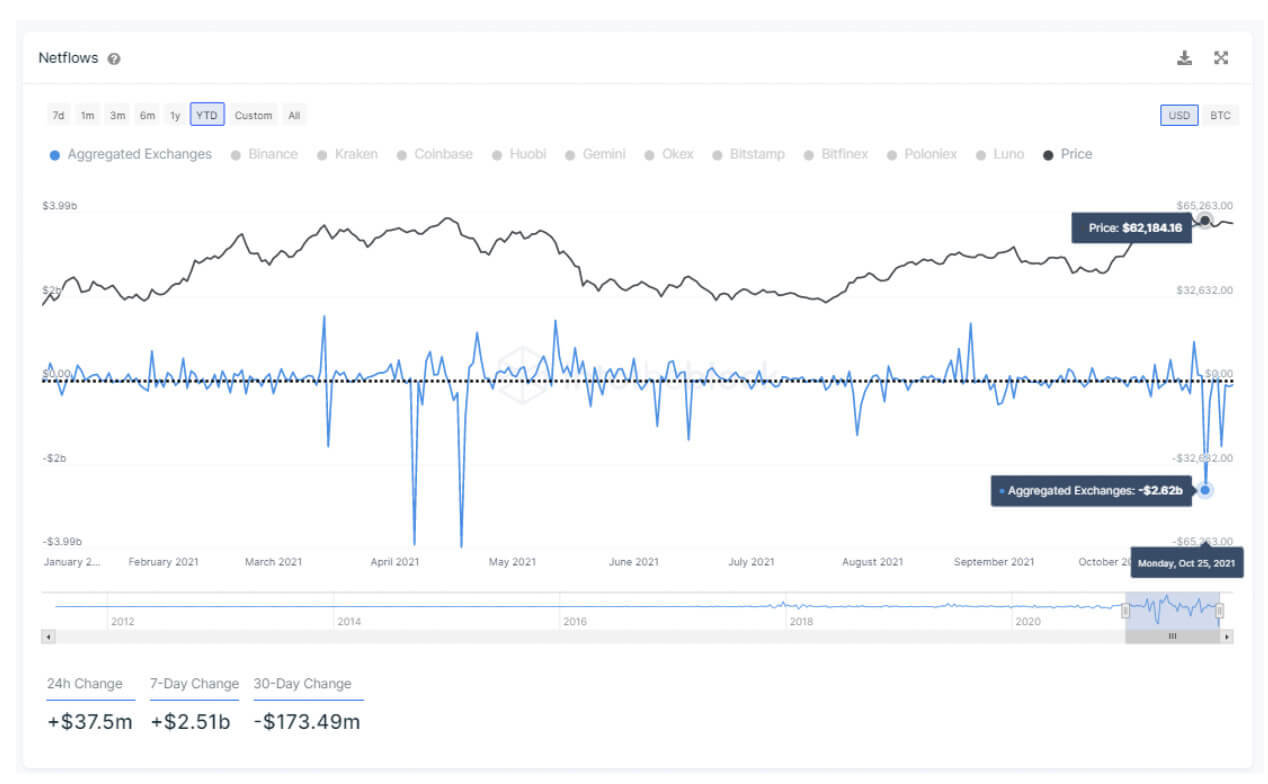
As can be appreciated in the chart, these last weeks had notorious negative netflows, with one day peaking up to $2.68bn. This points to a large sum of coins leaving exchanges towards investors’ personal addresses. This trend suggests accumulation and may alleviate selling pressure that could arise when surpassing all-time highs for Bitcoin again.
The sum of bullish indicators and the cumulation of recent positive macro perspectives over Bitcoin do not point at any signs that would make investors turn their bullish view to bearish for the end of the year. Even though some Altcoins will outperform Bitcoin, it still remains as the leader with more than 40% of the total crypto market, and the first onboarding coin for many investors that enter the space, either retail, institutional or even countries.
Guest post by Juan Pellicer from IntoTheBlock
Juan Pellicer is a Research Analyst at IntoTheBlock and systems engineer interested in DeFi, stablecoins, derivatives, synthetic assets, and NFTs.
Get an edge on the cryptoasset market
Access more crypto insights and context in every article as a paid member of CryptoSlate Edge.
On-chain analysis
Price snapshots
More context

Like what you see? Subscribe for updates.
 Bitcoin
  Ethereum
  Tether
  BNB
BNB  USDC
USDC  XRP
XRP  Solana
  TRON
TRON  Figure Heloc
  Hyperliquid