

Bitcoin price started a steady increase above the $47,000 resistance against the US Dollar. BTC even broke $48,000 and it might continue to rise in the near term.
- Bitcoin started a steady increase above the $46,000 and $47,000 resistance levels.
- The price is now trading above $47,000 and the 100 hourly simple moving average.
- There is a key bullish trend line forming with support near $48,000 on the hourly chart of the BTC/USD pair (data feed from Kraken).
- The pair could accelerate higher towards the $50,000 level if it breaks the $48,500 resistance.
Bitcoin Price Gains Traction
Bitcoin price started a steady increase above the $46,000 resistance level. BTC was able to clear the $47,000 resistance zone and the 100 hourly simple moving average.
Finally, there was a clear break above the $48,000 resistance zone. The price traded as high as $48,481 and it is now consolidating gains. An immediate support on the downside is near the $48,000 level. There is also a key bullish trend line forming with support near $48,000 on the hourly chart of the BTC/USD pair.
Bitcoin is also trading well above the 23.6% Fib retracement level of the upward wave from the $43,375 swing low to $48,481 high. An immediate resistance on the upside is near the $48,200 level.
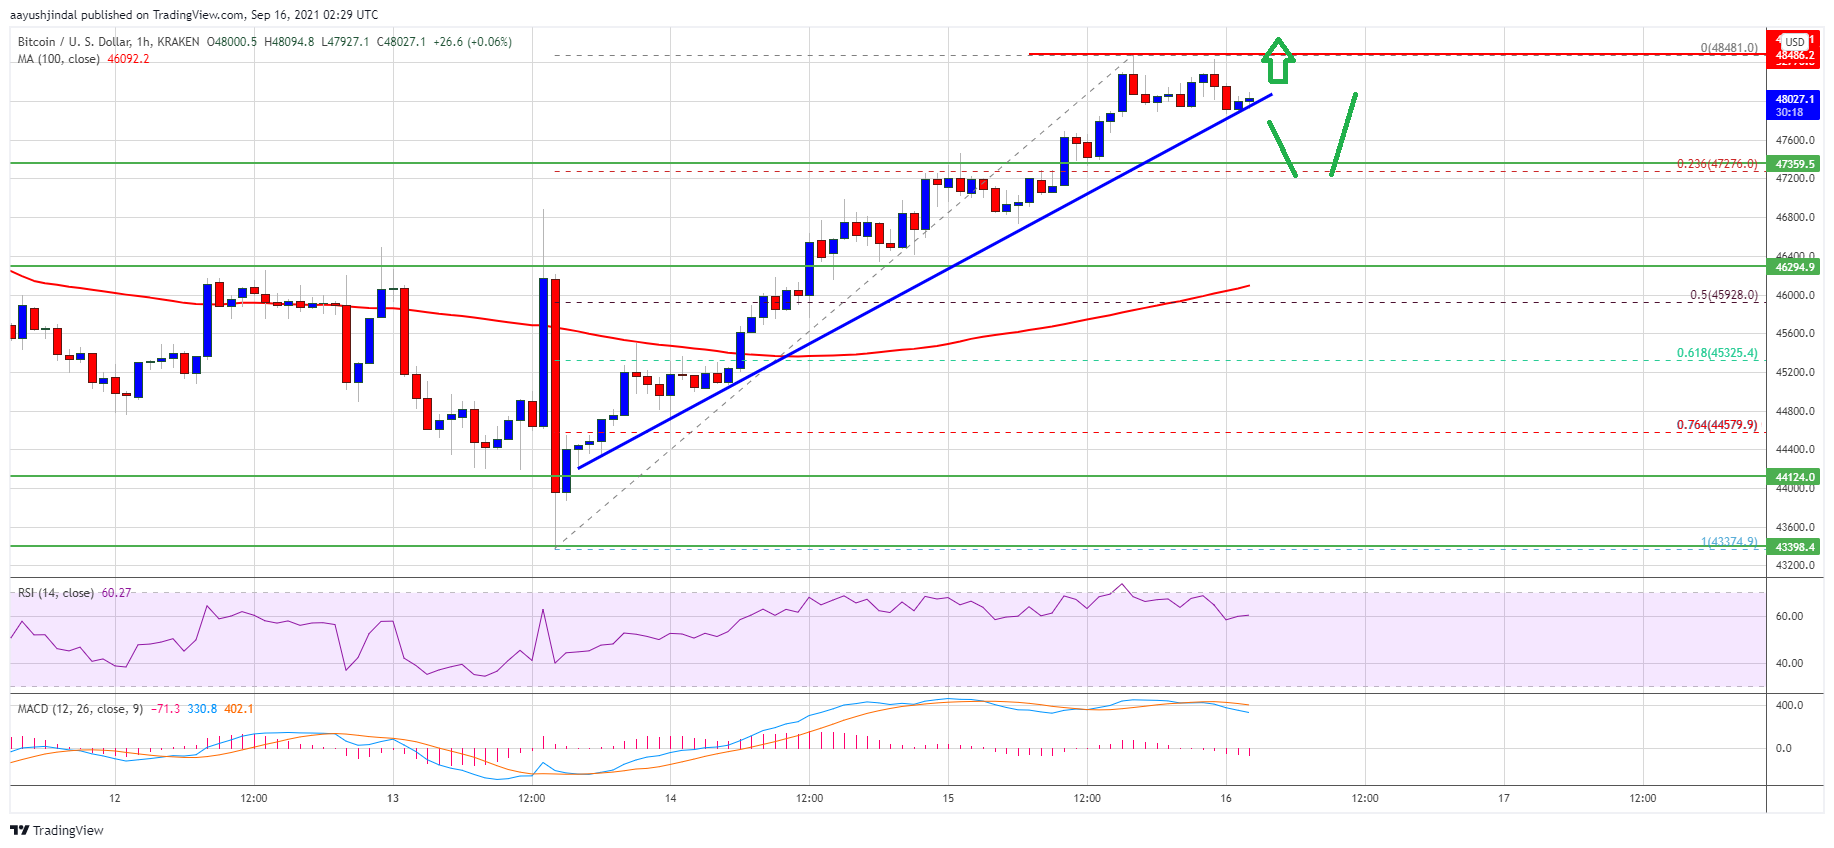
Source: BTCUSD on TradingView.com
The first major resistance is now near the $48,500 zone. To continue higher, bitcoin must clear the $48,500 resistance. If the bulls succeed, the price could easily rise towards the key $50,000 resistance in the near term. Any more gains may possibly set the pace for a move towards the $52,000 level.
Dips Supported In BTC?
If bitcoin fails to clear the $48,500 resistance zone, it could start a downside correction. An immediate support on the downside is near the $48,000 level and the trend line.
If the price breaks the trend line support, it could test the $47,400 support level. The next major support is near the $46,000 level or the 100 hourly simple moving average. It is also close to the 50% Fib retracement level of the upward wave from the $43,375 swing low to $48,481 high.
Technical indicators:
Hourly MACD – The MACD is slowly gaining pace in the bearish zone.
Hourly RSI (Relative Strength Index) – The RSI for BTC/USD is now well above the 50 level.
Major Support Levels – $47,500, followed by $47,000.
Major Resistance Levels – $48,200, $48,500 and $50,000.
 Bitcoin
  Ethereum
  Tether
  BNB
BNB  USDC
USDC  XRP
XRP  Solana
  TRON
TRON  Figure Heloc
  Hyperliquid