

Bitcoin price is trading below the $48,000 resistance zone against the US Dollar. BTC could decline heavily if it fails to stay above the $46,500 support zone.
- Bitcoin failed to surpass $48,250 and dropped back to $46,500.
- The price is now trading well below $48,000 and the 100 hourly simple moving average.
- There is a key bearish trend line forming with resistance near $47,850 on the hourly chart of the BTC/USD pair (data feed from Kraken).
- The pair could accelerate further lower if there is a break below the $46,500 support zone.
Bitcoin Price Tests Key Support
Bitcoin price attempted an upside break above the $48,000 resistance zone. However, BTC remained below the 100 hourly simple moving average and topped near the $48,250 level.
A high was formed near $48,245 and the price started another decline. It broke the $47,500 and $47,000 support levels. It traded close to the $46,500 support zone and a low is formed near $46,540. It is now consolidating losses near the 23.6% Fib retracement level of the recent decline from the $48,245 swing high to $46,540 low.
Besides, bitcoin is now trading well below $48,000 and the 100 hourly simple moving average. On the downside, there is a key support forming near the $46,500 zone.
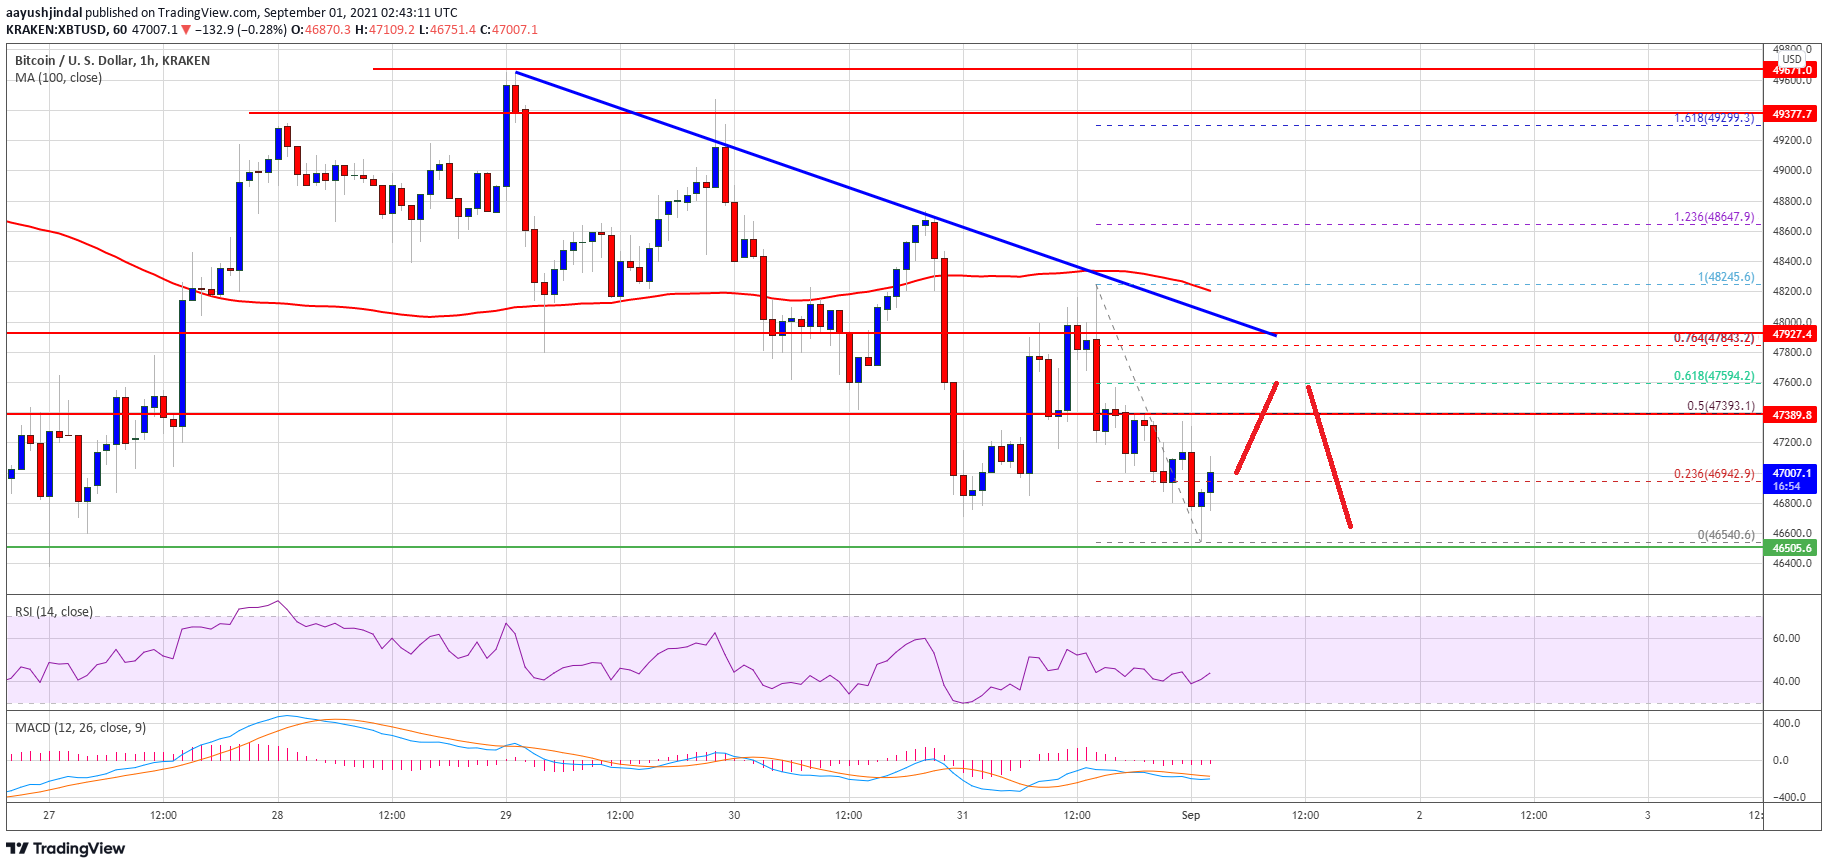
Source: BTCUSD on TradingView.com
If there is a downside break below the $46,500 support zone, the price might accelerate lower. The next major support is near the $45,500 level, below which the price could revisit $45,000. Any more downsides may possibly set the pace for a larger decline towards $42,000.
Fresh Increase In BTC?
If bitcoin stays above the $46,500 support zone, it could start a fresh increase. An immediate resistance on the upside is near the $47,200 level. The first major resistance is near the $47,400 level. It is close to the 50% Fib retracement level of the recent decline from the $48,245 swing high to $46,540 low.
The main resistance is near the $48,000 level and the 100 hourly simple moving average. A clear break above the $48,000 level could clear the path for a decent increase in the near term.
Technical indicators:
Hourly MACD – The MACD is gaining pace in the bearish zone.
Hourly RSI (Relative Strength Index) – The RSI for BTC/USD is well below the 50 level.
Major Support Levels – $46,500, followed by $45,000.
Major Resistance Levels – $47,200, $47,400 and $48,000.
 Bitcoin
  Ethereum
  Tether
  BNB
BNB  USDC
USDC  XRP
XRP  Solana
  TRON
TRON  Figure Heloc
  Hyperliquid