

- Dogecoin price explodes for a 28.14% gain on August 7, branding it as the largest daily gain since the 100.03% rise on April 16.
- DOGE logs the third consecutive positive week for just the third time in 2021.
- Mild spike higher in social dominance fails to gain traction, pointing to the lack of FOMO in the market for the token.
Dogecoin price did not attract interest from July 22 to August 6, trading in a tight range and creating the basis for a sharp move, highlighted by the compressing of the Bollinger Bands to a level similar to what preceded the April rally. With the 28.14% gain on August 7, DOGE now trades well above the 50-day simple moving average (SMA) resistance, improving the outlook for the digital asset. It now becomes a question of whether the events on the weekend were technical due to the excessive price compression or the beginning of a sustainable rally.
Dogecoin price is now at an inflection point
Dogecoin price closed last week with a 17.70% gain, marking the best weekly return since the beginning of June, raising the monthly gain to 25.50% at the time of writing and nearly reaching the previously discussed price target of $0.291, the June 25 high.
With the June 25 high test, Dogecoin price is now at an inflection point. If the spike was a technical event due to the significant price compression, DOGE should soon reverse below the 50-day SMA and target a new correction low.
Alternatively, suppose it is the beginning of a sustainable rally. In that case, Dogecoin price may consolidate around the June 25 high of $0.291, forming a handle of a cup-with-handle pattern that began on June 25.
The measured move of the DOGE cup-with-handle base is 44%, suggesting a price target of $0.417.
As long as Dogecoin price remains above the three highs of July 28 at $0.220, July 30 at $0.222 and August 1 at $0.220 on a daily closing basis, DOGE should complete the cup-with-handle pattern and be primed to explore the price target of $0.417.
DOGE/USD daily chart
Adding to the potential for an important Dogecoin price move is the upcoming bullish Golden Cross pattern on the six-hour chart when the 50 six-hour SMA crosses above the 200 six-hour SMA. The previous Golden Cross occurred at the beginning of April, before the kickstart of the historic DOGE rally. Moreover, the rally in November 2020 was preceded by a Golden Cross on the six-hour chart.
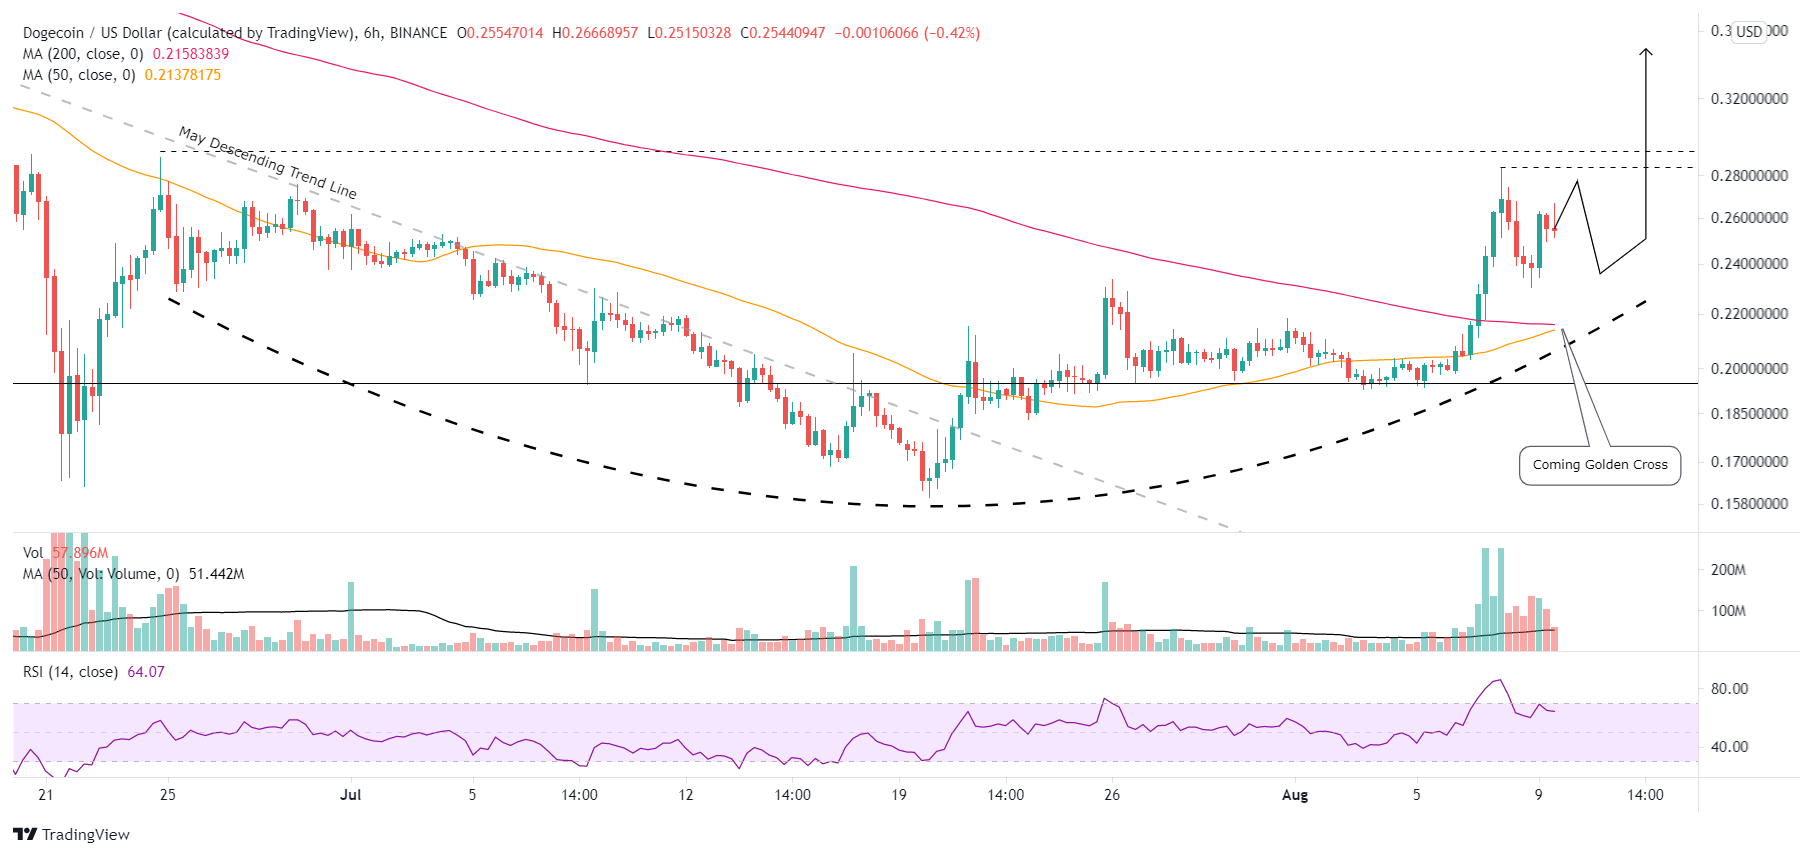
DOGE/USD 6-hour chart
An inability to hold the $0.220 on a daily closing basis defeats the cup-with-handle base scenario and positions Dogecoin price for at least a test of the 50-day SMA at $0.215 and possibly the 200-day SMA at $0.201.
Critical to much of the gains in 2021 was the role of social media dominance and the resulting fear of missing out (FOMO). A rise in social media traffic accompanied the recent burst higher, but the percent of social media traffic associated with DOGE versus a basket of cryptocurrencies has quickly retraced. It is not a bullish development, especially for a digital token that had enjoyed the best times when social media dominance ran over 40% of total traffic.
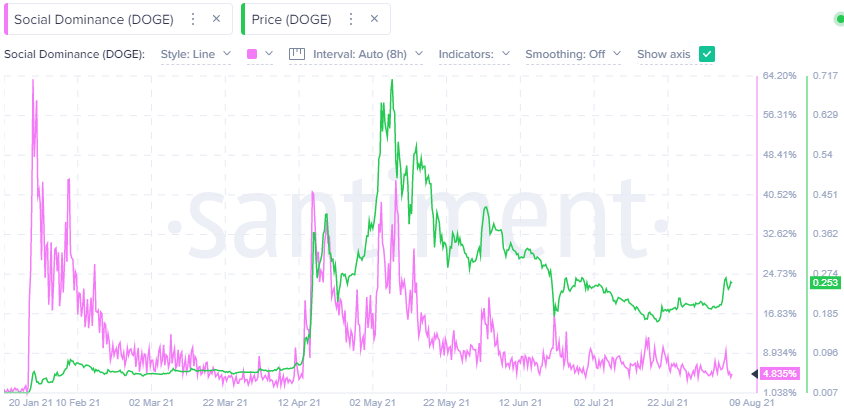
DOGE Social Dominance – Santiment
Last week may have been a transformative moment for the Dogecoin price structure or just a brief technical event. How DOGE consolidates the gains will dictate how the inflection point will be resolved, but with social media hype already back at the previous low levels, it casts a shadow on the bullish narrative.
Here, FXStreet’s analysts evaluate where DOGE could be heading next after it hit the forecasted target.
 Bitcoin
  Ethereum
  Tether
  BNB
BNB  USDC
USDC  XRP
XRP  Solana
  TRON
TRON  Figure Heloc
  Hyperliquid