

- Ripple breaks the uptrend that had assumed an ascending parallel pattern.
- Dogecoin price breakdown could extend to $0.16 following a descending triangle pattern confirmation.
The cryptocurrency market turned bearish as the week’s trading nears the tail end. Bitcoin price can barely hold above $33,000 as losses to $30,000 linger. Ethereum price failed to break above $2,400 and is currently seeking support at $2,200. Most crypto assets are in the red, posting single-digit losses.
Ripple:-
The international money transfer token closed in on $0.7 this week, but the barrier remained intact. In addition, the 50 Simple Moving Average (SMA) added credibility to the overhead pressure. Meanwhile, Ripple trades at $0.63 after losing support at the 100 SMA.
At the moment, support is expected $0.6 in a bid to avoid losses from extending to $0.5. The Relative Strength Index (RSI) adds credence to the bearish outlook based on its movement toward the oversold area.
The Moving Average Convergence Divergence (MACD) indicator has a massive bearish signal that came into the picture when the 12-day exponential moving crossed below the 26-day EMA. Realize that the downtrend will also be confirmed when the MACD drops into the negative region.
XRP/USD four-hour chart

Dogecoin:-
Dogecoin has lost nearly 8% of its value in the last 24 hours. The meme coin continued to drop, following its all-time of around $0.75. As the technical picture reveals, the downtrend is far from over.
Realize that a descending triangle pattern on the four-hour chart has a massive bearish signal. Moreover, the triangle support has been shattered already, paving the way for a 27% downswing to $0.16 (June support).
It is worth mentioning that the descending triangle is highly bearish and marks the continuation of a downtrend. Therefore, if support at $0.2 fails to hold, investors should brace for another colossal dip, as mentioned.
DOGE/USD four-hour chart
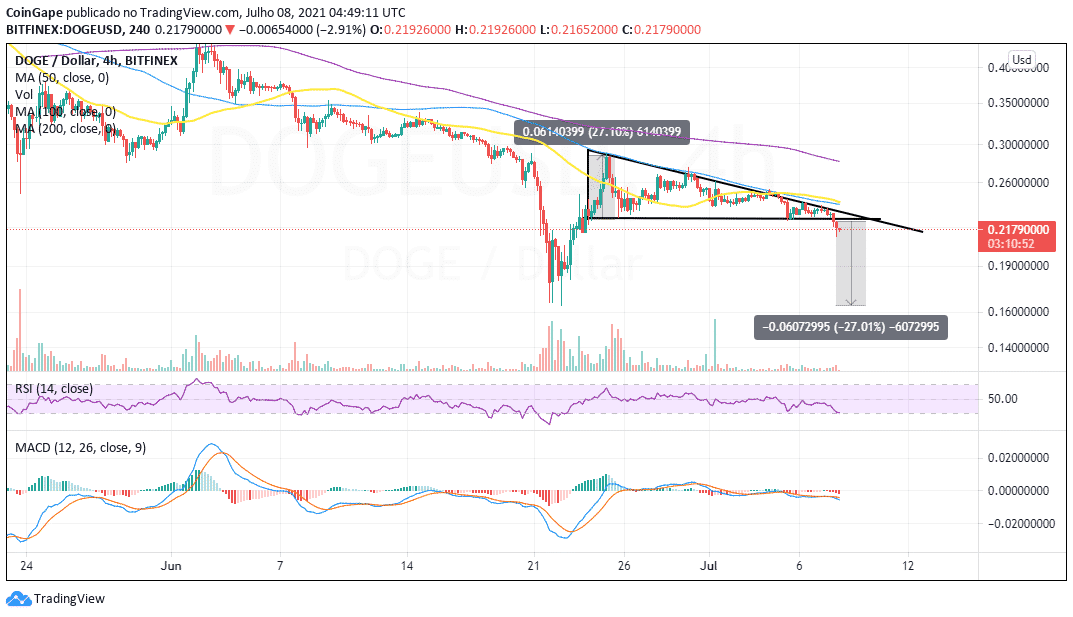
The Moving Average Convergence Divergence (MACD) indicator and the Relative Strength Index (RSI) add credence to the bearish picture. For now, the least resistance path is south as the MACD explores the levels beneath the mean line (0.00). Similarly, the RSI accentuates the bearish grip on Dogecoin.
Disclaimer
The presented content may include the personal opinion of the author and is subject to market condition. Do your market research before investing in cryptocurrencies. The author or the publication does not hold any responsibility for your personal financial loss.
About Author

 Bitcoin
  Ethereum
  Tether
  BNB
BNB  USDC
USDC  XRP
XRP  Solana
  TRON
TRON  Figure Heloc
  Hyperliquid