

Bitcoin (BTC/USD), Ethereum (ETH/USD),Litecoin (LTC/USD), Technical Analysis – Talking Points
- Bitcoin struggling to extended April’s bounce, Rising Wedge still in play
- Ethereum and Litecoin are showing signs of fading upside momentum
- Technical highlights include Doji & Hanging Man candlesticks
Bitcoin Technical Outlook
Bitcoin has been struggling to resume its late-April bounce, continuing to idle around the 57563 inflection point set back in February. This is leaving its breakdown out of a bearish Rising Wedge still in play, hinting that BTC/USD remains at risk. Having said that, the 100-day Simple Moving Average (SMA) is maintaining the long-term focus to the upside.
A push above the 57563 inflection point could open the door to revisiting the March peak at 61788 which may act as another inflection level before facing the all-time high set last month. Beyond the latter is the 61.8% Fibonacci extension at 69395. On the other hand, resuming last month’s top entails taking out the April low at 47044, aiming for the key 44850 – 43016 support zone.
BTC/USD – Daily Chart
Ethereum Technical Outlook
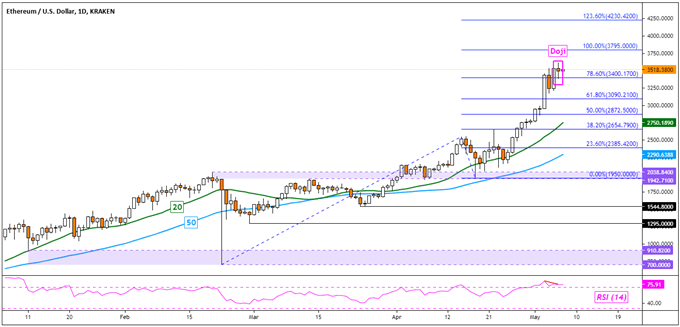
Ethereum has been extending gains into record all-time highs, but near-term momentum seems to be fading. ETH/USD left behind a Doji candlestick, which is a sign of indecision. This is as negative RSI divergence hints at a top. Immediate support appears to be the 78.6% Fibonacci extension at 3400, with the 61.8% level under that at 3090.
Below that, the 20 and 50-day SMAs could reinstate the dominant focus to the upside in the event of a material turn lower. On the other hand, overturning warnings signs from the Doji and RSI divergence places the focus in immediate resistance at 3795. Beyond that sits the 123.6% Fibonacci extension at 4230.
ETH/USD – Daily Chart
Litecoin Technical Outlook
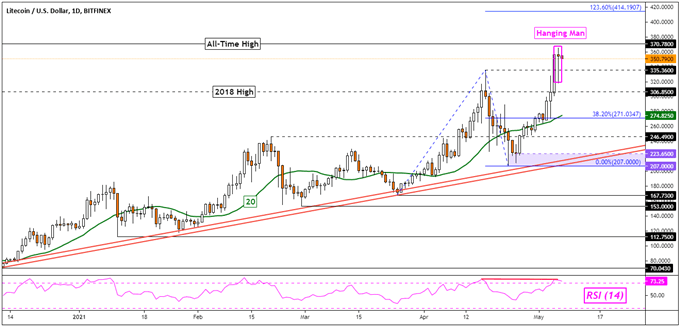
Litecoin also extended recent gains, pushing price action closer to the all-time high set in 2017 at 370.78. But, LTC/USD left behind a Hanging Man candlestick pattern. This can be an early warning sign of a top when it appears within an uptrend. This is also coupled with negative RSI divergence, showing fading upside momentum which can at times precede a turn lower.
Immediate support could be the April high at 335.36, which may come into play as an inflection point. Under that sits the 2018 peak which acted as resistance in the middle of April. Further losses from there could place the focus on the 20-day SMA, which may reinstate the upside focus. Otherwise, pushing into new all-time highs would expose the 123.6% Fibonacci extension at 414.
LTC/USD Daily Chart
— Written by Daniel Dubrovsky, Strategist for DailyFX.com
To contact Daniel, use the comments section below or @ddubrovskyFX on Twitter
https://www.tradingview.com/symbols/LTCUSD/?exchange=BITFINEX
 Bitcoin
  Ethereum
  Tether
  BNB
BNB  USDC
USDC  XRP
XRP  Solana
  TRON
TRON  Figure Heloc
  Hyperliquid