

Dogecoin price broke down from a symmetrical triangle pattern on March 22 and proceeded to decline for the next four days; however, volume was not showing a race to the exits. DOGE has since tested the upper trendline of the broken triangle on three days, and on two of those days, the altcoin briefly tested the 0.50 retracement level. The lack of staying power points to considerable overhead and a lack of commitment.
Dogecoin price needs to overcome a critical Fibonacci level
On April 1, Elon Musk tweeted out that “SpaceX is going to put a literal Dogecoin on the literal moon,” and immediately the digital token roared higher, hitting $0.0725 before closing at $0.0616. It has turned out to be a short-lived event, and DOGE has since scrambled sideways with volatility.
DOGE outlook is neutral but with a slight bearish tilt moving into the second half of this week. Downside support materializes at the new rising trendline from the March 25 low at $0.0535, followed by the March 25 low at $0.0483.
On the downside, some support may unfold at the 0.618 Fibonacci retracement level at $0.0428, but the noteworthy support is the 100-day simple moving average (SMA) confluence at $0.0409 with the February low at $0.0408. Below that level, traders should put on a parachute.
DOGE/USD daily chart
The IntoTheBlock’s In/Out of the Money Around Price (IOMAP) data refutes to some extent the neutral to bearish tilt. It indicates that bearish speculators will need to muster heavy selling pressure to break Dogecoin price below $0.0508.
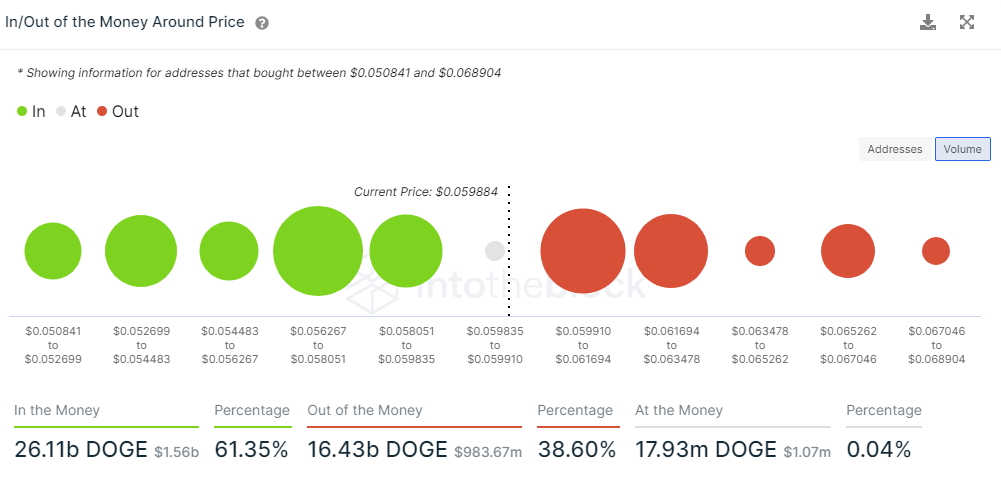
Dogecoin IOMAP chart
In light of the IOMAP data, traders need to label their charts with the resistance levels to confirm whether a new rally is coming to fruition and where to increase risk.
First and foremost, DOGE needs to close above the 0.50 retracement level of the February decline on a daily basis. The next resistance is the 0.618 retracement level at $0.0738, followed more importantly by the highest weekly closing price at $0.0781.
If momentum is sustained, the February high at $0.0943 will be vulnerable, and the January high at $0.1004.
 Bitcoin
  Ethereum
  Tether
  BNB
BNB  USDC
USDC  XRP
XRP  Solana
  TRON
TRON  Figure Heloc
  Hyperliquid