- Dogecoin price is contained inside a descending triangle pattern on the 4-hour chart.
- One key resistance level separates DOGE from massive breakout.
- The digital asset has been trading sideways for the past two days.
Dogecoin price has been trading sideways for the past two days and inside a downtrend since its new all-time high of $0.087 on February 7. Now, the favorite canine-cryptocurrency is ready for a new leg up.
Dogecoin price faces critical barrier before a massive breakout
On the 4-hour chart, Dogecoin has established a descending triangle pattern with its critical resistance trendline at $0.052. A breakout above this point should swiftly push Dogecoin price towards $0.07, a 37% move calculated using the height of the pattern as a reference point.
DOGE/USD 4-hour chart
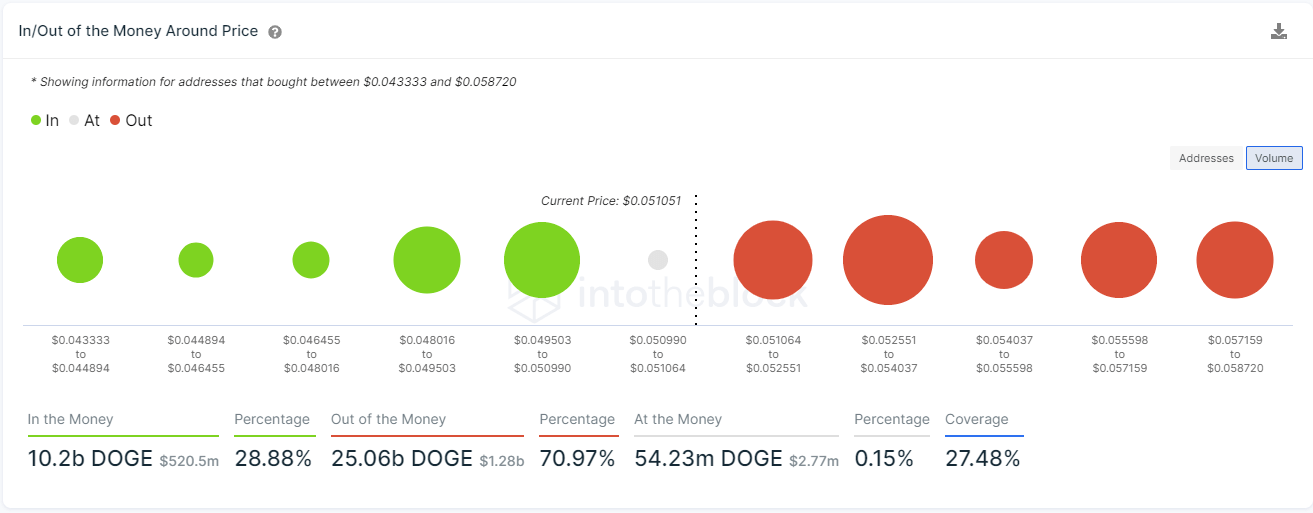
The In/Out of the Money Around Price (IOMAP) chart shows steep resistance ahead above $0.052. The strongest resistance barrier is located between $0.052 and $0.054 which coincides with the outlook above adding credence to the bullish view.
DOGE IOMAP chart
However, on the way down, the IOMAP model shows weak support. The most significant range is located between $0.05 and $0.049 which means that a breakdown below this point would drive Dogecoin price down to $0.044.


 Bitcoin
  Ethereum
  XRP
XRP  Tether
  Solana
  USDC
USDC  Dogecoin
  Lido Staked Ether
  Cardano