

The Dog Meme Altcoin ‘DOGE’, the native cryptocurrency of Dogecoin has been receiving lots of boost from its market community over the past weeks with yearly highs recorded on Binance at $0.10.
*DOGE buyers eye triangle breakout at $0.671
*DOGE/USD correction continues as support holds ahead of a larger rally
*The Popularity of the coin bolstered DOGE price soaring 1150%
Dogecoin’s price went ballistic from a low level of $0.0279 to reach highs of $0.10 and entered a consolidation phase. After its major rallies, the DOGE/USD correction continues as support holds ahead of the larger rally. Amid the upside traction DOGE buyers eye triangle breakout at $0.670. From the weekend highs at $0.0623 to levels at $0.0555 low today, overall recovery was able to hold. In 24 hours, the trading volume is $871 million and the market capitalization is at $7.39 billion.

The Progression of Dogecoin
Dogecoin was launched in 2013 based on the popular “doge” meme at the time which involved a Shiba Inu dog. The popularity of the coin bolstered the DOGE price soaring 1150% so far this year. Earlier Dogecoin (DOGE) embarked on a massive pump-and-dump spree spurred on by r/Wallstreetbets inspired by Elon Musk’s tweets, surging to highs of $0.1 on Jan 29. DOGE the native cryptocurrency of Dogecoin also received a boost, thanks to recent endorsements from rapper Snoop Dogg, Kiss’ Gene Simmons, and Elon Musk.
DOGE Daily Chart: Ranging
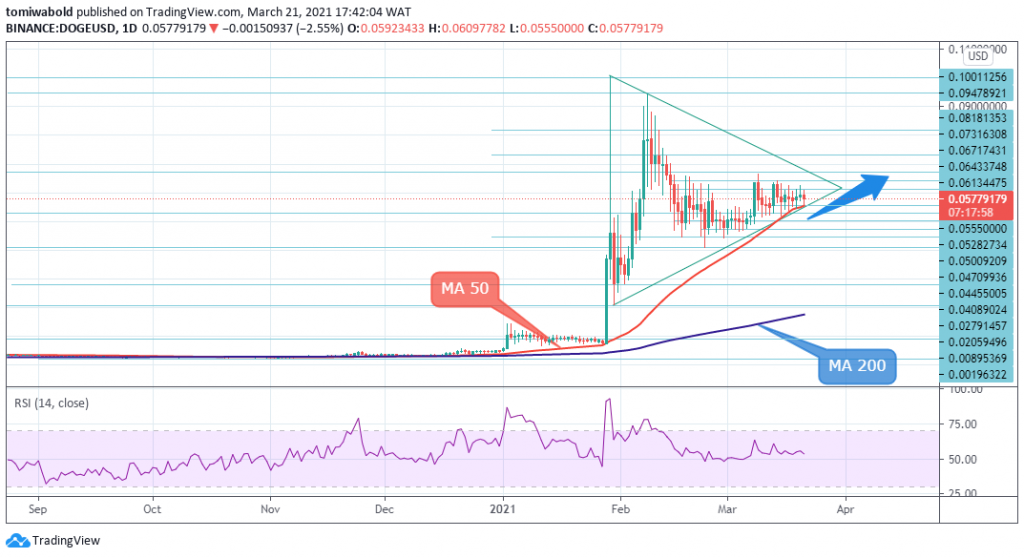
DOGE/USD bounced off the moving average (MA 50) at $0.0555 to confront the congestion wall around $0.060-$0.065 on the daily chart, which has been a crucial obstacle to upside movements since the start of the month. The sideways trajectory in the RSI, the candlesticks pattern, and the supporting MA 50 lines are in favor of a sustained consolidation at the moment but are not taking the bears’ side either.
Therefore, buyers will probably wait for the triangle breakout above $0.067 before targeting the key $0.070 – $0.080 area, which also encapsulates the upper surface of the medium-term consolidation channel. Another step lower from here would shift the spotlight towards the MA 50 at $0.0555, though a rally beneath would violate the triangle pattern in the bigger picture.
DOGE 4-Hour Chart: Ranging
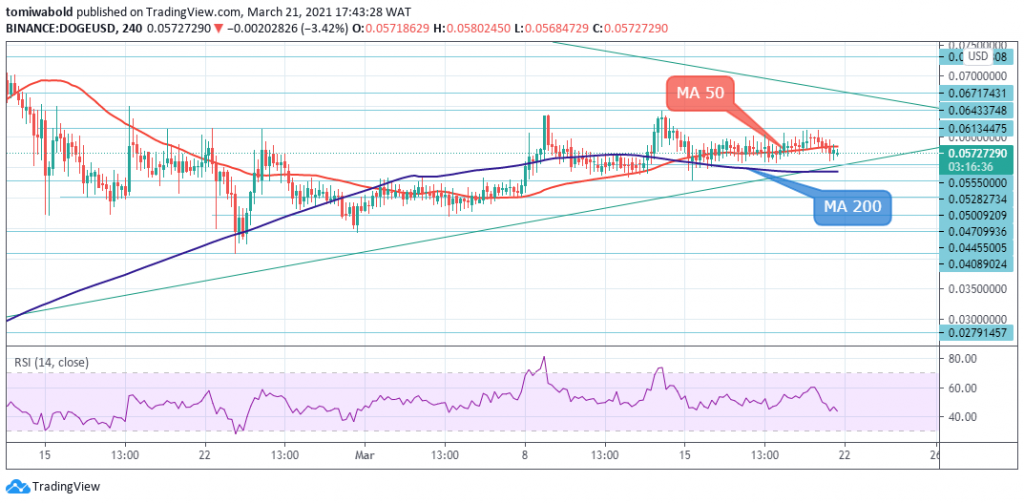
From the technical perspective of the 4-hour time frame, DOGE/USD lost the MA 50 support while trading inside the triangle channel. If selling pressure resurfaces, the moving average (200) at $0.054 may prevent any decline towards the next major support at $0.050. Should the sell-off extend below $0.050, the price could revisit the restrictive area around $0.040, where any break lower would open the way towards the bottom of the bearish channel seen at $0.008.
Overall, DOGE is currently holding a neutral-to-bullish short-term bias. A break above the $0.067 ceiling would make the rebound of $0.055 more credible, while a drop below $0.050 could raise negative risks in the market. Rising bearish momentum on the relative strength index (RSI) supports the notion, along with short-term MA 50 and 200 bear crosses.
Key Levels
Resistance Levels: $0.081, $0.073, $0.067
Support Levels: $0.055, $0.047, $0.040
Image Credit: Tradingview
Note: coinpedia.org is not a financial advisor. Do your research before investing your funds in any financial asset or presented product or event.
 Bitcoin
  Ethereum
  Tether
  BNB
BNB  USDC
USDC  XRP
XRP  Solana
  TRON
TRON  Figure Heloc
  Hyperliquid