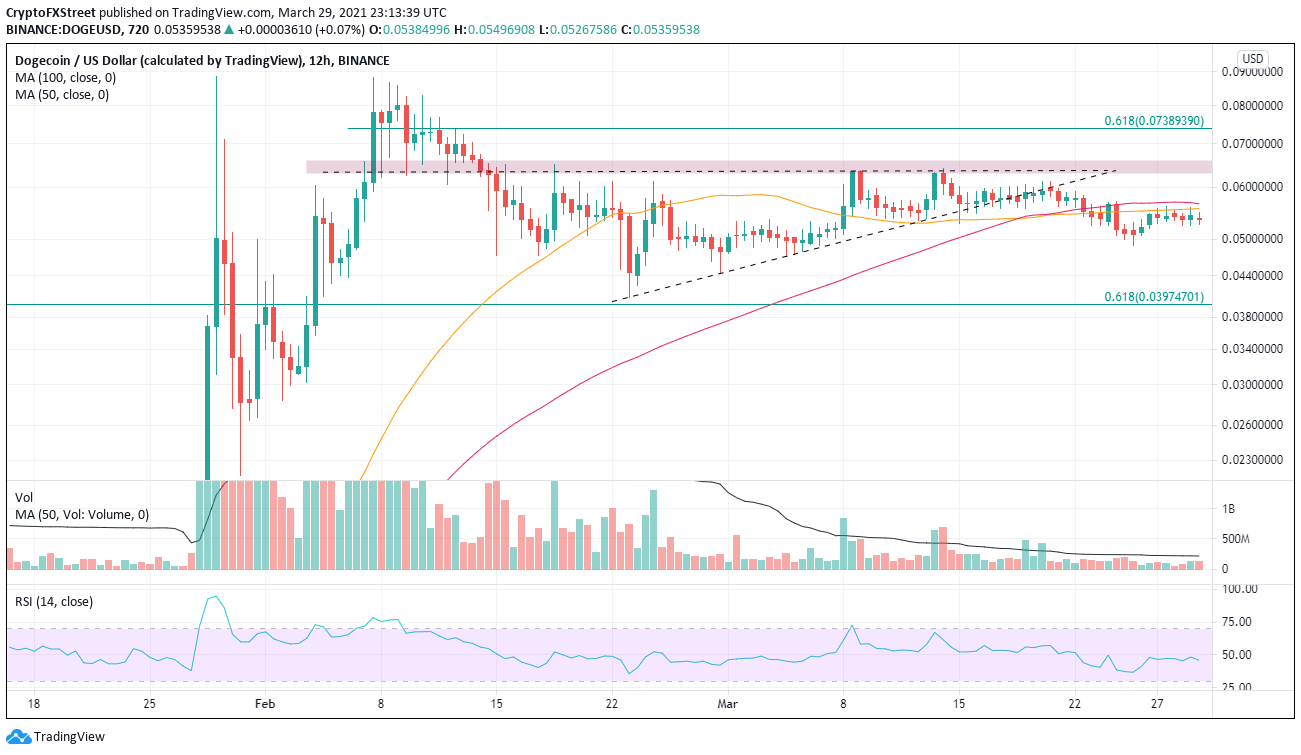
- Dogecoin price is now locked below crucial moving averages.
- Ascending triangle has finally resolved to the downside.
- DOGE Relative Strength Index (RSI) still not at an oversold reading on the daily chart.
Dogecoin (DOGE) price is frustrating the bullish narrative and making the grand forecast of $1 by the end of 2021 look impossible. A failure to hold the lower bound of the ascending triangle and the ensuing collapse below the flattening 50-day simple moving average (SMA) for the first time since mid-December 2020 has shifted the bias from neutral to bearish in the short-term.
Dogecoin price faces mounting technical barriers
List all of Dogecoin’s supporters, Elon Musk, Mark Cuban, Gene Simmons, Lil Yachty, and Mia Khalifa, among others, lent their voice to the DOGE wave. The problem is that celebrity popularity only carries so much weight in the markets. As a result, since early March, the altcoin has struggled to get price traction and finally succumbed to selling pressure last week.
Price rolling over under moving averages is never a good development, and that is precisely the case on the 12-hour chart. Over the last six days, DOGE has struck resistance at the confluence of the 50 twelve-hour SMA and the 100 twelve-hour SMA at $0.056.
A break in Dogecoin price will not find credible support until the 0.618 Fibonacci retracement level, an advance from the November 2020 low to the January high at $.040, which represents a 25% decline from the current price. The next reliable support appears at the 100-day SMA at $0.036.
DOGE/USD 12-hour chart
Bullish projections face resistance at $0.056 and then the ascending triangle’s upper boundary at $0.064, and the price congestion around $0.066. If bulls have the stamina, the 0.618 Fibonacci retracement of the February plunge at $0.074 is a potential target.


 Bitcoin
  Ethereum
  Tether
  Solana
  USDC
USDC  XRP
XRP  Lido Staked Ether
  Dogecoin
  Toncoin