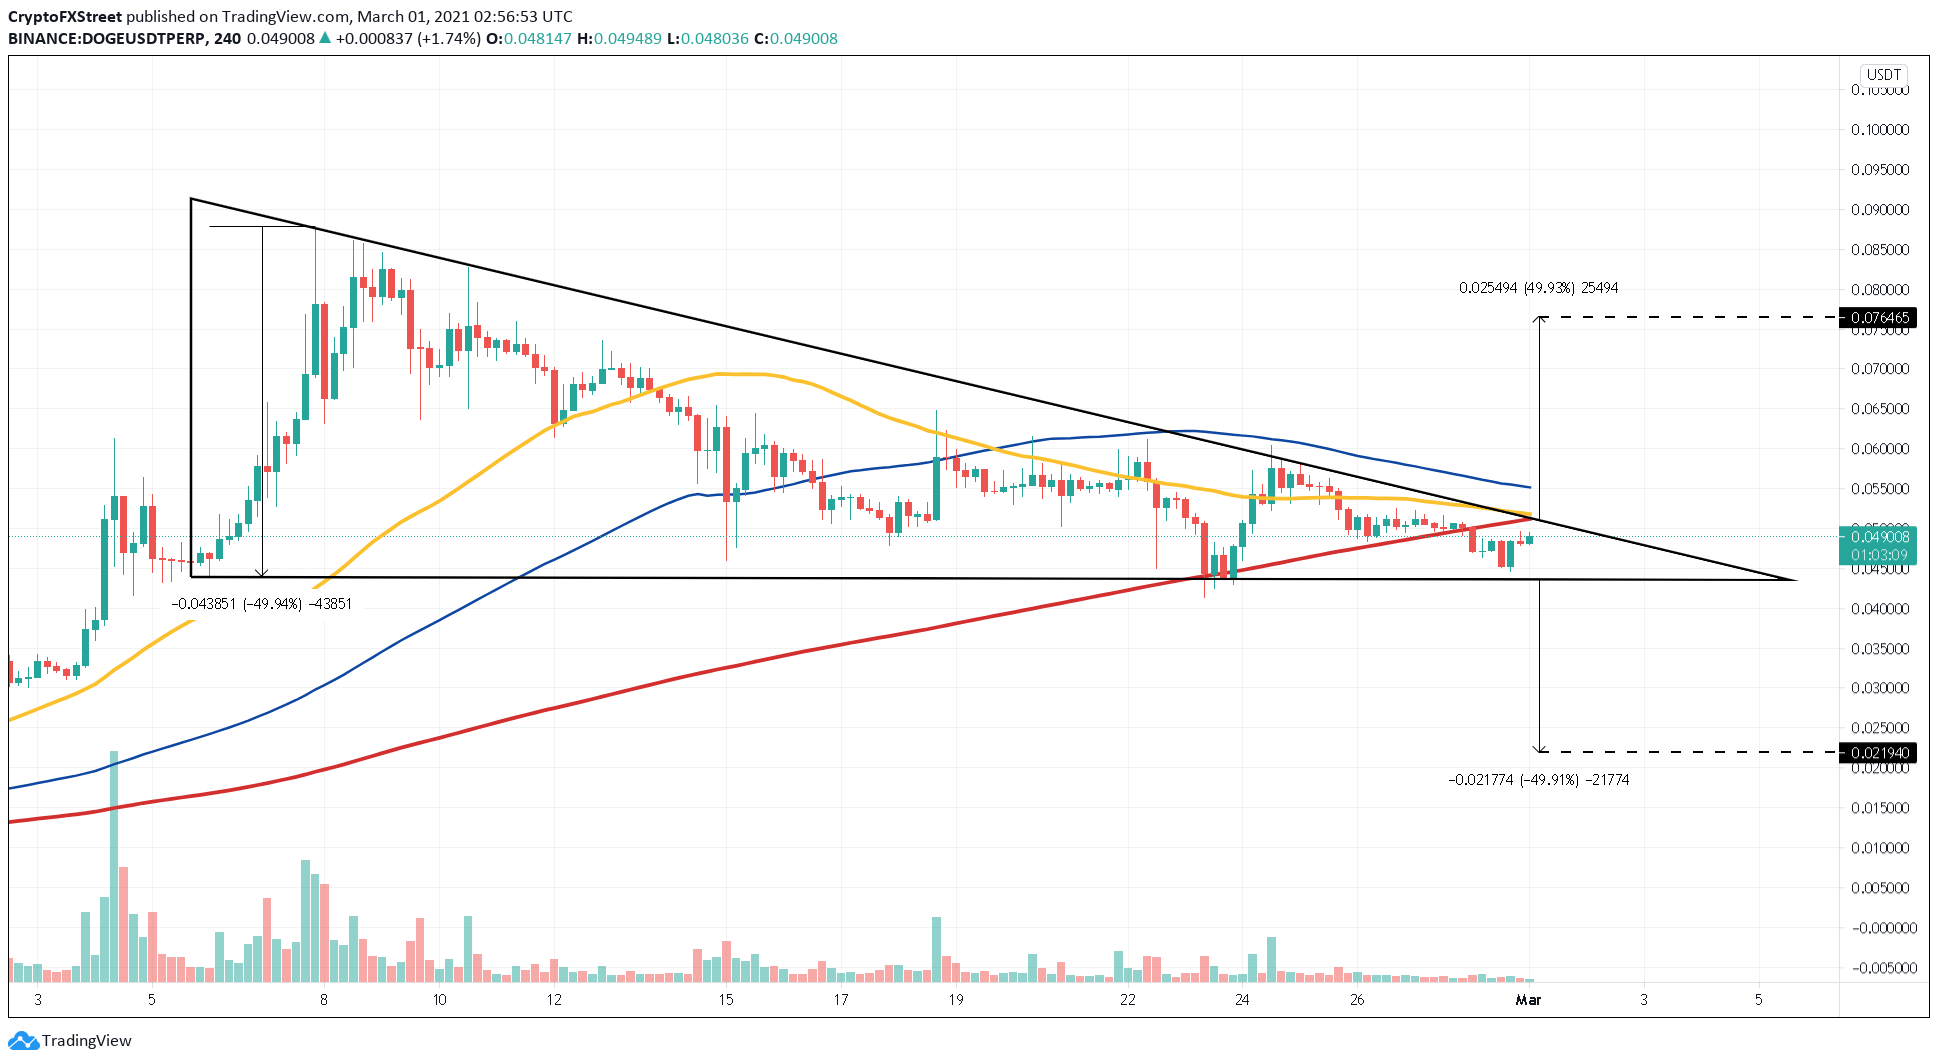
- Dogecoin price is consolidating in a descending triangle pattern, hinting at a 50% breakout soon.
- DOGE has slid below the support provided by the 50, 100, and 200 four-hour moving averages indicating a lack of buyers.
- A breakdown of the $0.043 support level would trigger a 50% sell-off to $0.021.
- On the flip-side, if DOGE slices through the resistance at $0.051, then a bullish scenario might come into play.
Dogecoin price shows a lack of buying activity, which has led to its 45% descent from $0.087 to $0.048. In doing so, DOGE has flipped significant demand barriers into supply barriers. Therefore, upswings must have more oomph to slice through these levels.
Dogecoin price eyes a lower low
Dogecoin price action since February 7 has resulted in a lower high due to aggressive sellers. Each lower high bounced off a stable support barrier at $0.043. By connecting these lower highs and the horizontal support barrier, a descending triangle pattern forms.
The technical formation forecasts a 50% downswing, which is the distance between the swing high and the flat demand level, added to the breakout point at $0.043. This target puts DOGE at $0.021.
Adding credence to this bearish outlook is DOGE’s move under the 50, 100, and 200 four-hour moving averages (MA), which deter any upside movement. Hence, a spike in selling pressure leading to a 4-hour candlestick close below the flat support level at $0.043 will confirm a bearish breakout. In this case, Dogecoin price will head towards the $0.021 level.
DOGE/USDT 4-hour chart
On the other hand, if Dogecoin price manages a four-hour candlestick close above $0.051, it will invalidate the bearish thesis. In such a case, DOGE could surge 50% to hit a target of $0.076.


 Bitcoin
  Ethereum
  Tether
  Solana
  USDC
USDC  XRP
XRP  Lido Staked Ether
  Dogecoin
  Toncoin