- On the 4-hour chart, Dogecoin price has established a descending broadening wedge pattern.
- This pattern is considered bullish and a reversal indicator.
- The digital asset faces one critical resistance level before a potential breakout.
Dogecoin price has been in a downtrend since its all-time high of $0.087 on February 7. After the initial hype of Elon Musk died out, the digital asset started to consolidate but could be on the verge of yet another massive move without any help from the entrepreneur magnate.
Dogecoin price faces just this resistance level before new highs
On the 4-hour chart, Dogecoin price has established a descending broadening wedge pattern which is considered bullish, and it’s also called a reversal pattern.
DOGE/USD 4-hour chart
The critical resistance barrier is marked by the upper trendline of the pattern, currently established at $0.056. A breakout above this point would push Dogecoin price towards $0.0738, a 31% move calculated by using the first point of the upper trendline and the last touch of the lower trendline.
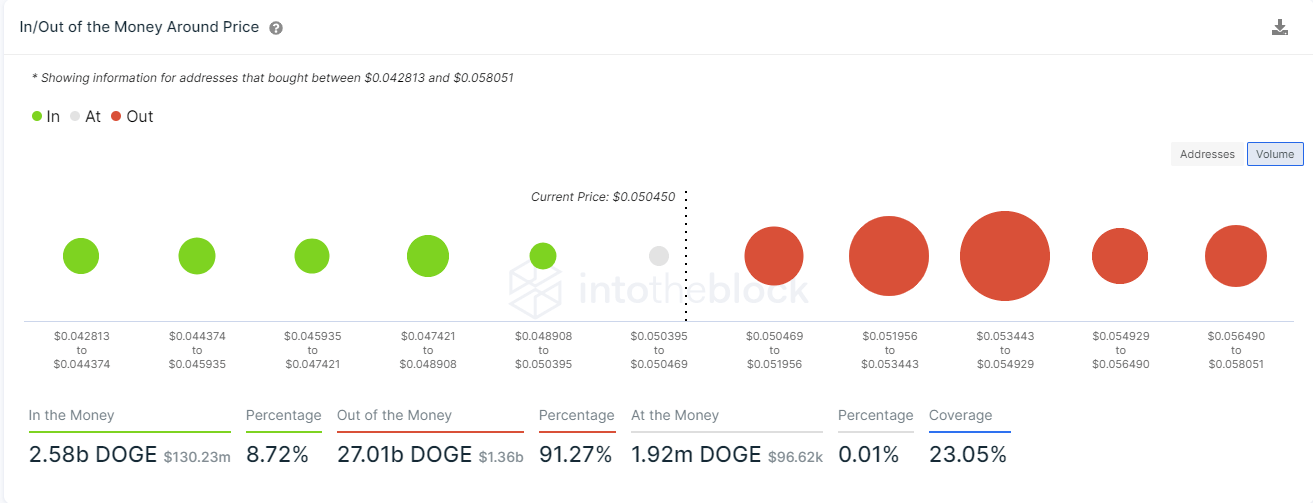
DOGE IOMAP chart
On the other hand, the In/Out of the Money Around Price (IOMAP) chart actually shows a lot of resistance to the upside above $0.052. The only significant support area seems to be located between $0.047 and $0.049. Losing this range would lead Dogecoin price down to $0.042.


 Bitcoin
  Ethereum
  XRP
XRP  Tether
  Solana
  USDC
USDC  Dogecoin
  Lido Staked Ether
  Cardano