

- Dogecoin price continues trading inside a descending triangle pattern on the 1-hour chart.
- The digital asset is close to a significant 20% breakout if it can beat a key resistance level.
- DOGE bulls must defend two important support levels to remain in control.
Dogecoin has been extremely volatile in the past week but has settled down in the past 24 hours. The digital asset has been trading sideways and awaits a potential 20% move to the upside if bulls can remain in control.
Dogecoin price must stay above this level to a chance of a 20% breakout
On the 1-hour chart, Dogecoin has established a descending triangle pattern with a resistance trendline located at $0.075. The current price of Dogecoin at $0.073 is right at a key support level where the 50-SMA and the 100-SMA levels converge.
DOGE/USD 1-hour chart
If the bulls can defend this key support level, Dogecoin price can quickly jump towards the upper trendline resistance at $0.075. A breakout above this point leads to a 22% move towards $0.09.
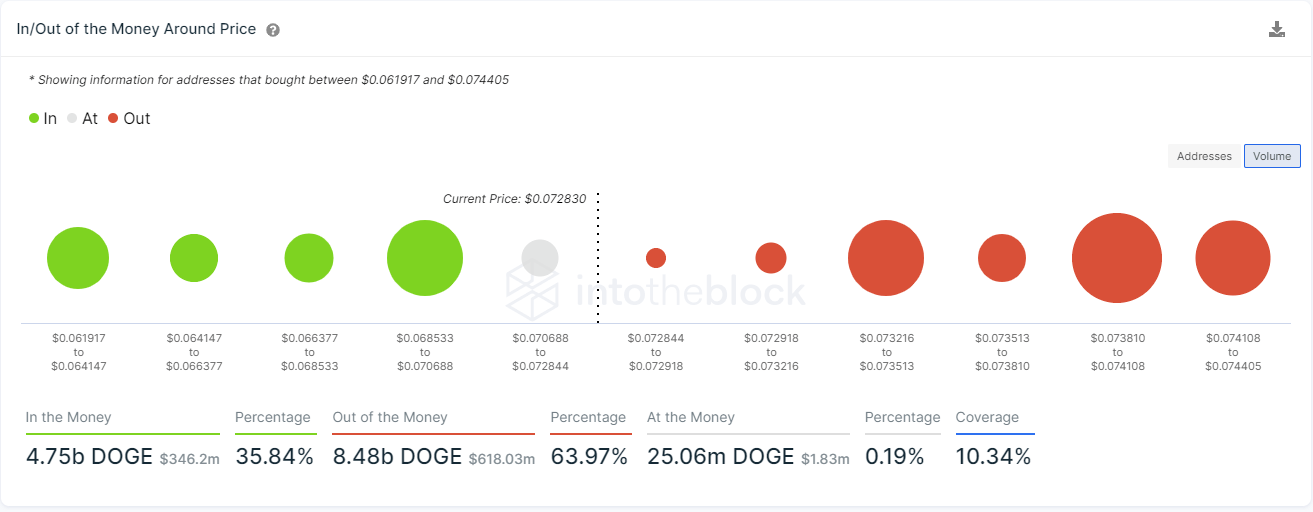
DOGE IOMAP chart
However, if Dogecoin price falls below $0.073, the next bearish price target would be the lower boundary of the descending triangle at $0.066. The In/Out of the Money Around Price (IOMAP) chart gives the upper hand to the bears as it shows a strong resistance level above $0.073. The most significant support area is located between $0.068 and $0.07 with 2.17 billion DOGE in volume, losing this range can quickly push Dogecoin price to the price target of $0.066.
 Bitcoin
  Ethereum
  Tether
  BNB
BNB  USDC
USDC  XRP
XRP  Solana
  TRON
TRON  Figure Heloc
  Hyperliquid