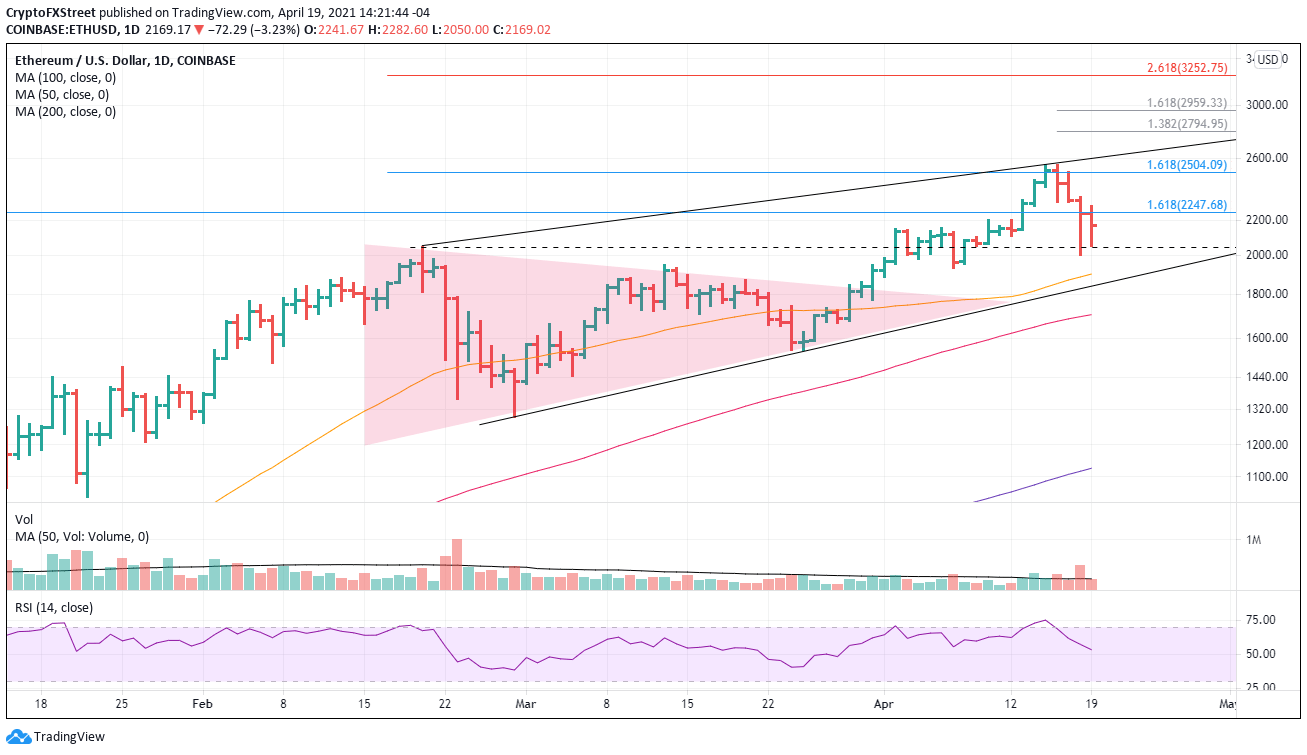
- Ethereum price rebounds to close Sunday in the top 25% of the daily range.
- ETH currently set to close with an inside day, suggesting selling exhausted.
- Be alert for a double bottom pattern on the intra-day charts.
Ethereum price has stabilized at the February 20 high at $2,041, keeping the longer-term bullish thesis intact. A daily close below the support would downgrade the working thesis and raise the odds of a deeper correction or a complete reset.
Ethereum price will return to the persuasive fundamental story of the blockchain
Ethereum Intheblock In/Out of the Money Around Price (IOMAP) data shows heavy resistance between $2,198 to $2,263, where 158.1k addresses bought 8.71 million ETH. The price range envelops the 161.8% Fibonacci extension of the 2018 bear market at $2,247.68.
ETH IOMAP data
Based on just a technical perspective, it is no surprise that yesterday’s close was $2,241, basically on the 161.8% extension of the 2018 bear market at $2,247.68. When you add the IOMAP data shown above, it becomes clear that a return of a more positive outlook starts with a daily close above $2,263.27.
The second level of resistance returns to the 161.8% extension of the February correction at $2,504, followed by the symmetrical triangle measured move target of $2,507. A daily close above the April 16 high of $2,548 would further support the rally in 2021.
The continuation of the rally will find resistance at the topside trend line currently at $2,605, the 138.2 extension of this correction at $2,795, and lastly, at the 161.8% of this correction at $2,959.
Traders with bigger aspirations should turn to the 261.8% extension of the February correction at $3,253.
ETH/USD daily chart
On the downside, there is a slow, incremental structure of support beginning with the 50-day simple moving average (SMA) at $1,901 and then the rising trendline from the February low at $1,833 followed by the 100-day SMA at $1,704.


 Bitcoin
  Ethereum
  Tether
  XRP
XRP  Solana
  Dogecoin
  USDC
USDC  Lido Staked Ether
  Cardano