

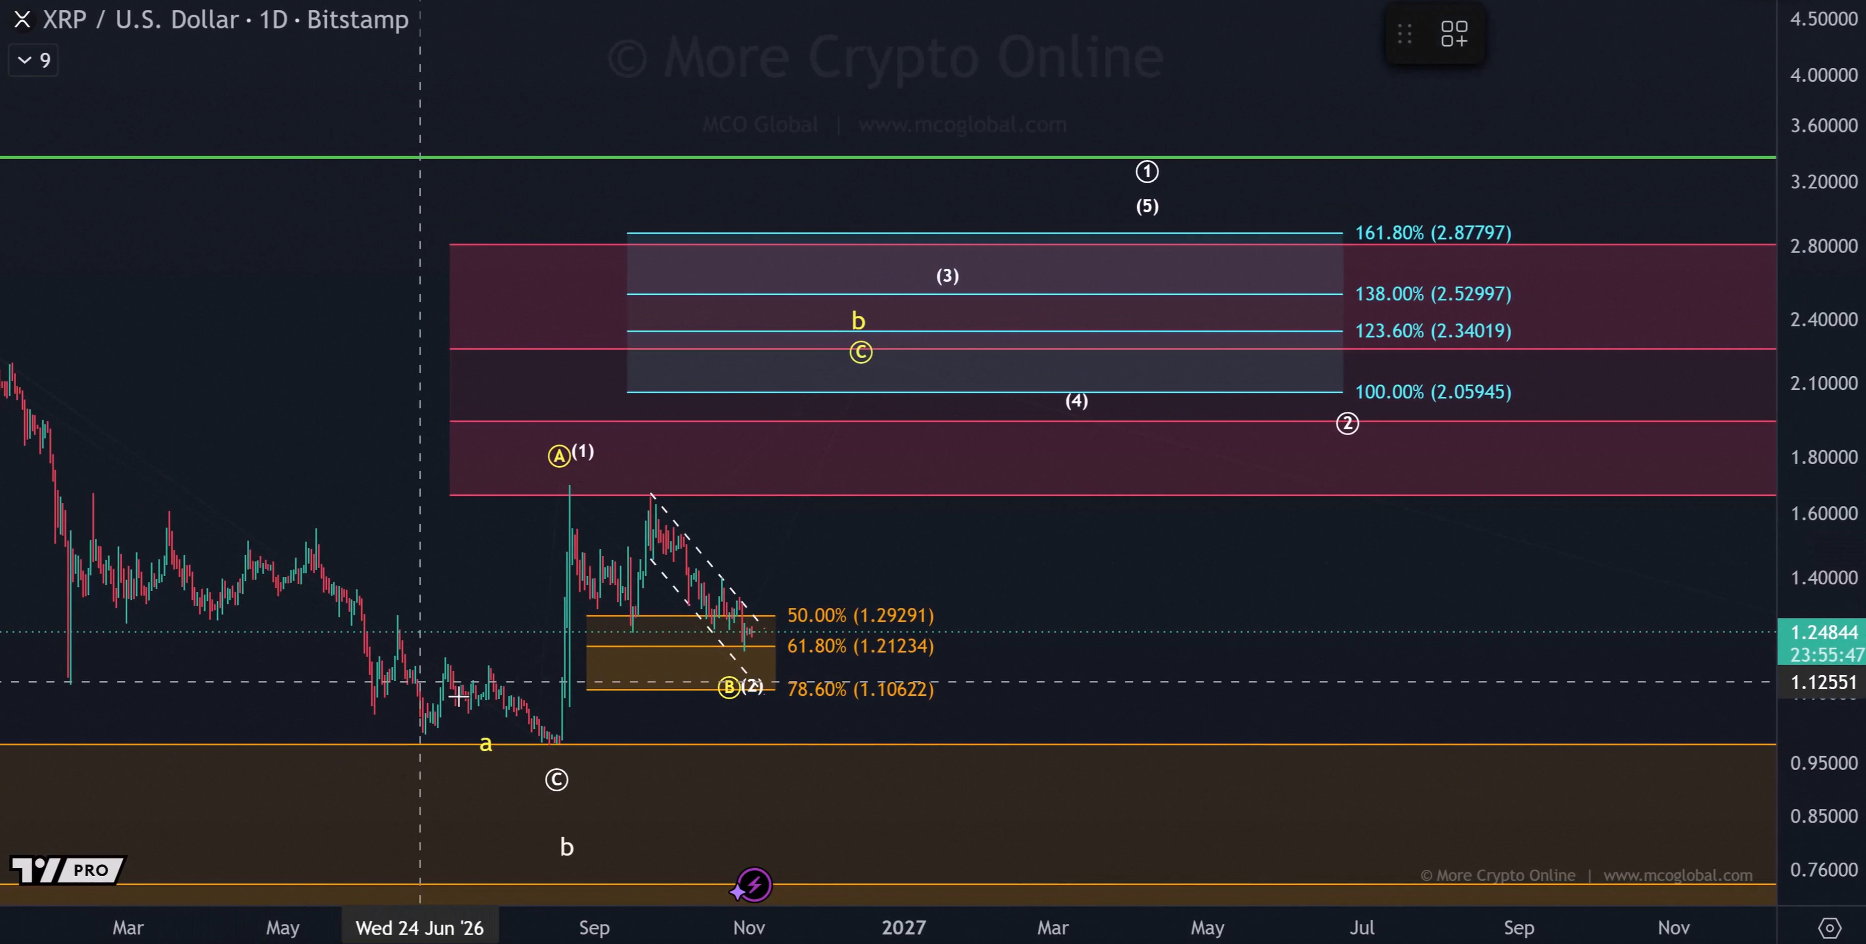
XRP is testing an important support zone as negative sentiment spreads across the crypto market, but what happens next could set up a path to $11.
Several altcoins have already fallen below their August 2026 lows, while others are getting close to those levels. XRP has also suffered losses, but it has held up better than much of the altcoin market.
XRP currently trades near $1.24, with buyers trying to defend the $1.21-$1.22 range. This area is important because two technical indicators point to the same level, which makes it an important support zone. How XRP reacts here could determine whether it recovers or continues to fall.
XRP Holds Up Better Than Much of the Altcoin Market
XRP lost 16% in October 2026 and now trades about 65.8% below its all-time high of $3.65, which it reached in July 2025. The asset is also down 32.1% since the start of 2026, while its losses over the past 12 months have exceeded 50%.
Although these figures show how much pressure XRP has faced, the token has performed better than several other altcoins during the current market downturn.
Much of the broader market correction has followed three-wave patterns. In Elliott Wave analysis, three-wave movements usually represent corrections, while five-wave movements show stronger moves in the direction of the prevailing trend.
If the current market pullbacks maintain their three-wave structures and Fibonacci support levels continue to hold, the market could have room for a recovery.
However, this does not guarantee a rebound. Support levels only show where buyers have previously entered the market and where selling pressure has weakened. They do not automatically signal that prices will rise.
XRP Chart Shows an ABC Correction
XRP price movement since August explains the current decline. The token rallied strongly from its August lows before reaching resistance around $1.69.
It then started a three-wave decline that took its price to a September low near $1.24. XRP recovered afterward, but the rebound turned out to be corrective. The token formed a lower high before falling again and recording a lower low.
Market analyst More Crypto Online says this price movement follows an ABC corrective pattern. In this structure, XRP can form a lower high and then a lower low without necessarily ending its larger bullish outlook. However, the deeper support levels must remain intact for this pattern to stay valid.
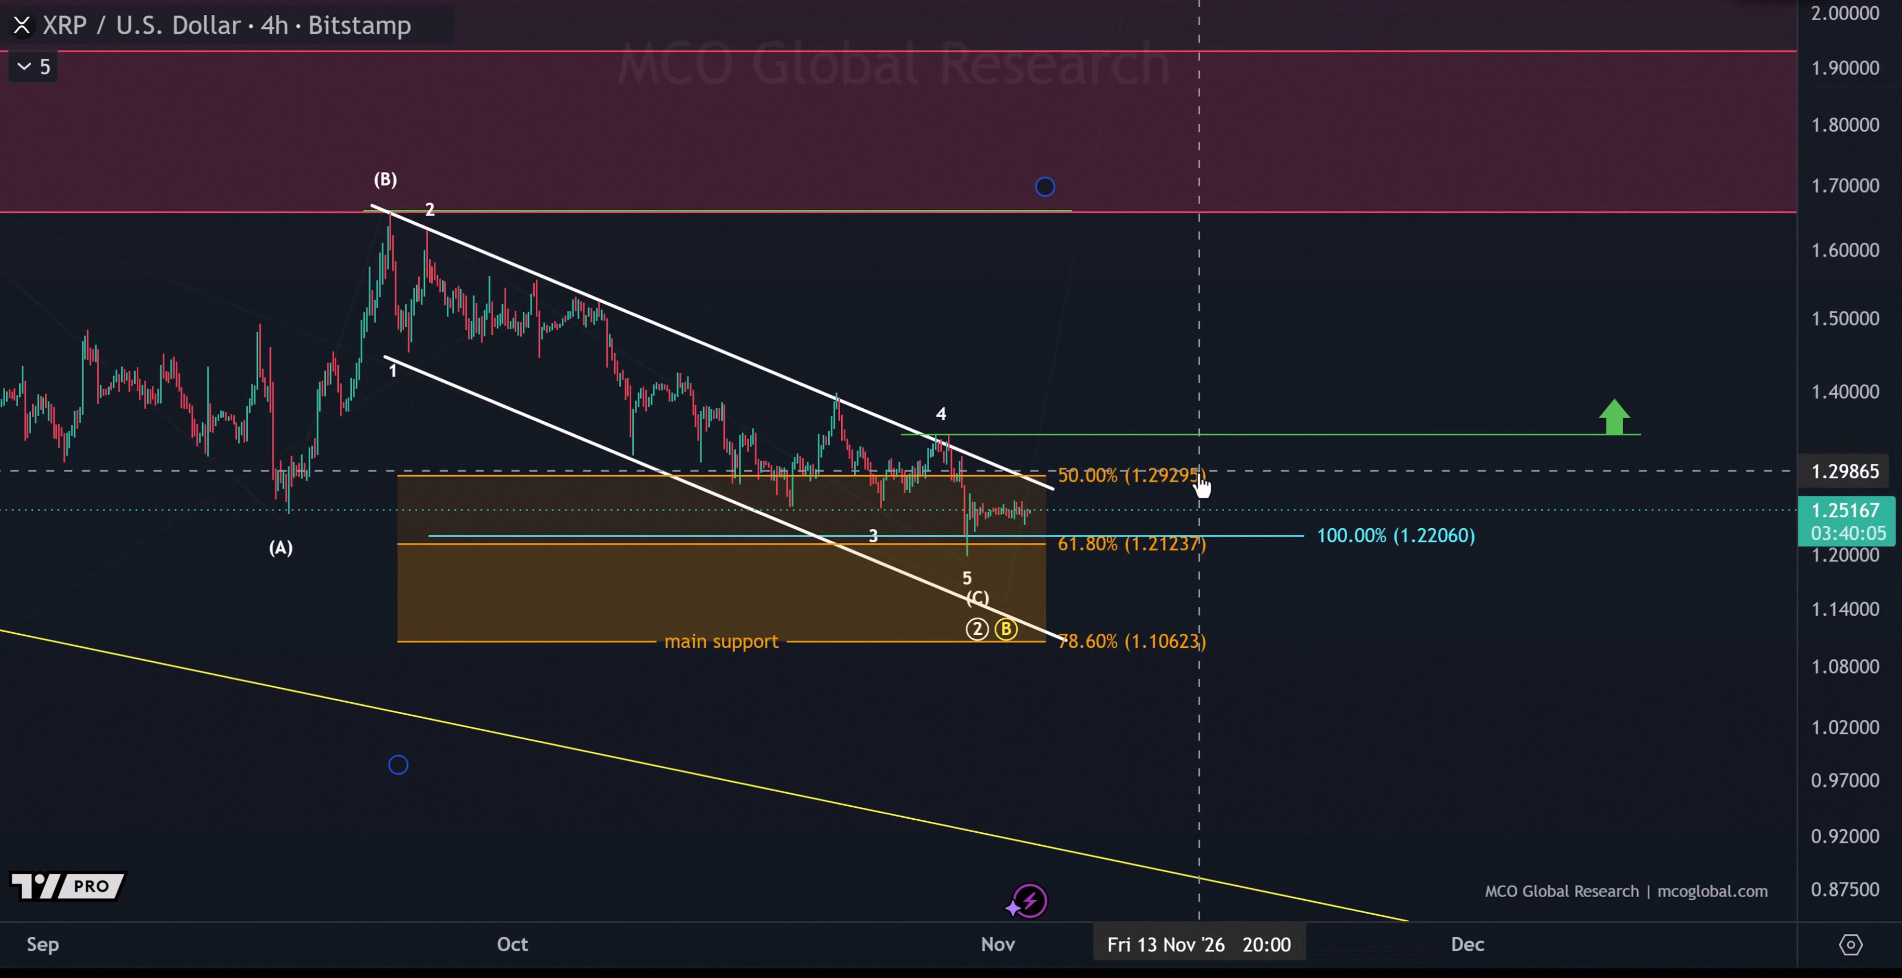
The immediate support area sits between $1.21 and $1.22. This zone is important because the 61.8% Fibonacci retracement level and the 100% extension of the previous decline meet around the same price. When two technical levels lead to the same area, they create a stronger support zone that could attract buyers.
The broader support range extends from $1.10 to $1.29, covering the 78.6% retracement down to the 50% retracement level measured from the August high. XRP is currently testing the upper part of this range.
What XRP Needs to Do to Confirm a Bottom
More Crypto Online says traders should pay attention to how XRP reacts around the current support instead of just focusing on the price level.
The analyst wants to see a small five-wave upward move on a shorter time frame. Such a move would provide the first meaningful sign that XRP may have found a local bottom. If this structure does not develop, the correction could continue.
A drop below $1.20 would raise concerns because this was XRP’s lowest price in October. If sellers push the token below that level, the next major support to watch would be around $1.09, which corresponds to the August 20 low.
For buyers to gain more confidence, XRP must also break above the upper boundary of the descending channel that has restricted its price movement over recent weeks.
Meanwhile, the Fear and Greed Index stands at 46, showing a market mood that remains balanced but cautious.
XRP ETFs also recorded $4.3 million in inflows during the final week of October, bringing their total assets to $1.42 billion. This shows that institutional interest has not disappeared, although ETF demand has yet to provide enough support to lift XRP price.
Another level to watch is $1.34. A move above this price would provide further evidence that buyers are gaining control. However, XRP would first need to break above the descending channel and reclaim $1.34 before a move toward the $2.00 region becomes a more realistic possibility.
Elliott Wave Analysis Eyes Possible $11 Target
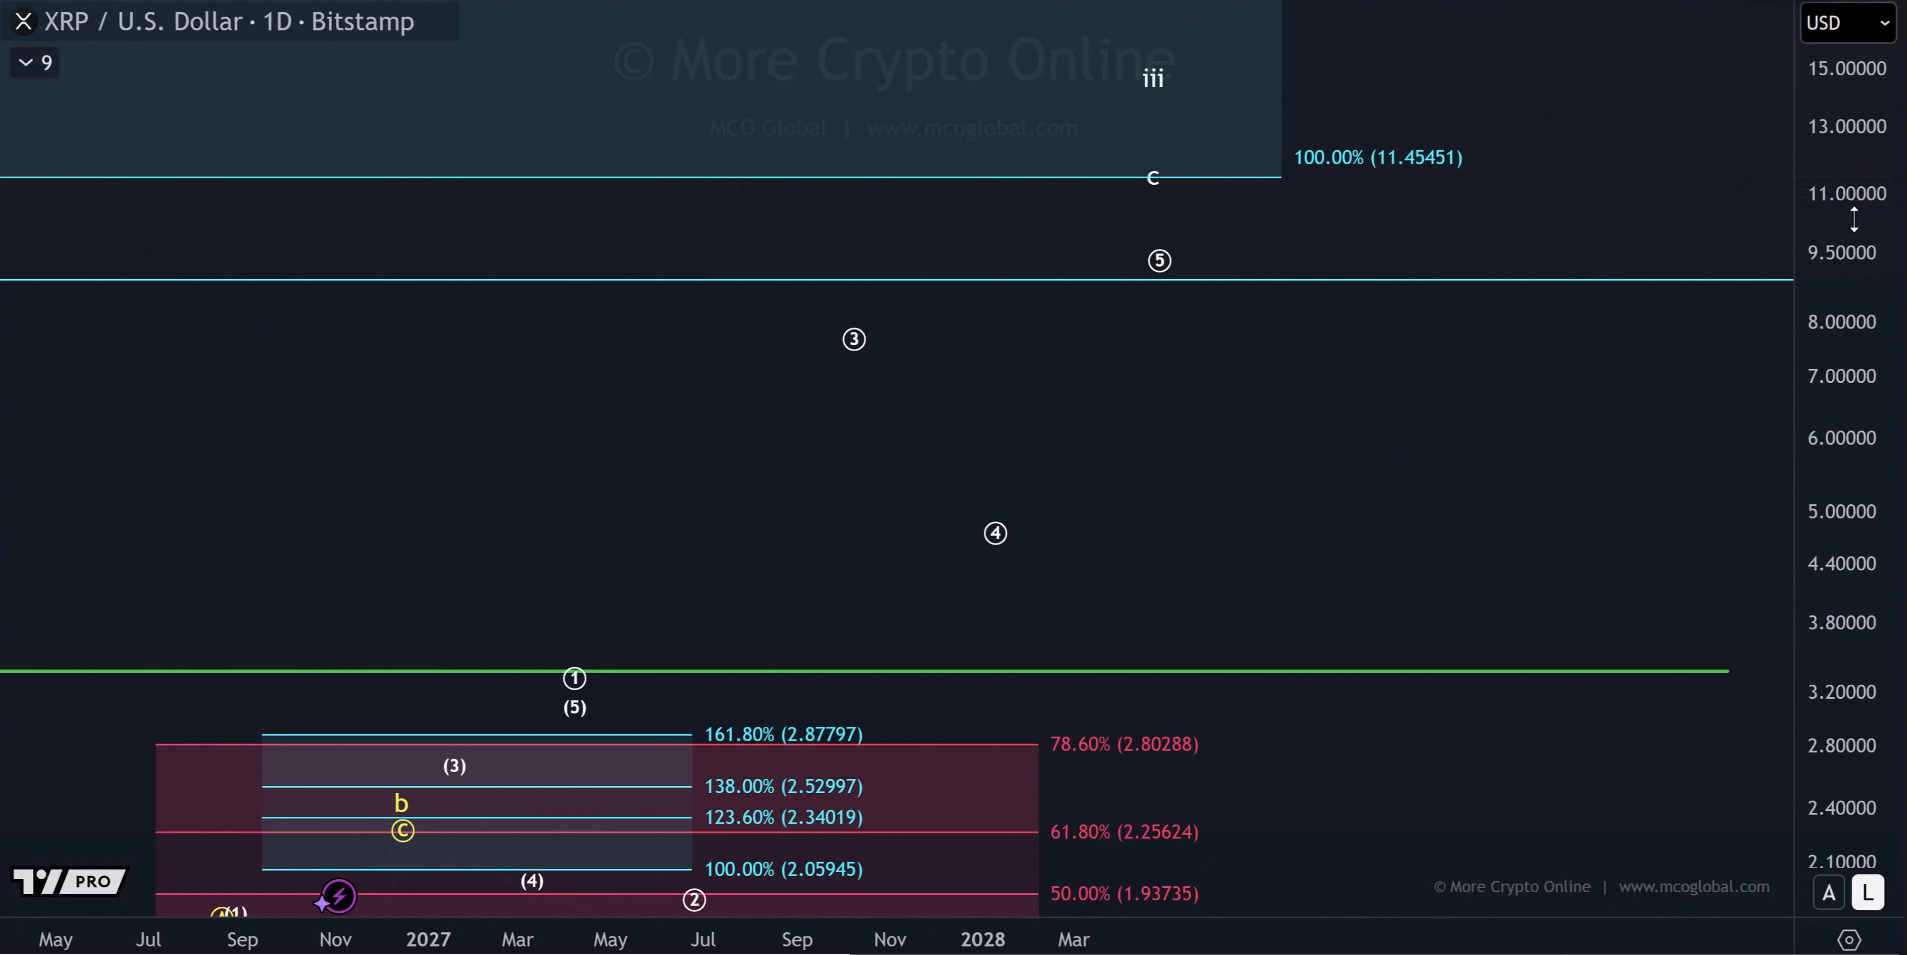
Beyond the current correction, the larger Elliott Wave outlook presents a possible path for XRP to reach $11.45. More Crypto Online calls this a long-term projection, not a confirmed price target. For the forecast to play out, XRP would still need to complete waves three, four, and five of a larger upward movement.
The current price structure involves a possible base, a rally, and a corrective pullback. The broader projection suggests that XRP would need to repeat a similar pattern on a much larger scale to support a move toward $11.45.
November could also bring sudden price movements for XRP. Historical data dating back to 2017 shows that the cryptocurrency has recorded November gains as high as 279.2% and losses of up to 23.4%.
This wide range shows how unpredictable the month has been for XRP. The asset’s rally from its August lows was sharp, but the correction that followed has developed much more slowly.
 Bitcoin
 Ethereum
 Tether
 BNB
 XRP
 USDC
 Solana
 TRON
 Figure Heloc
 Zcash
