

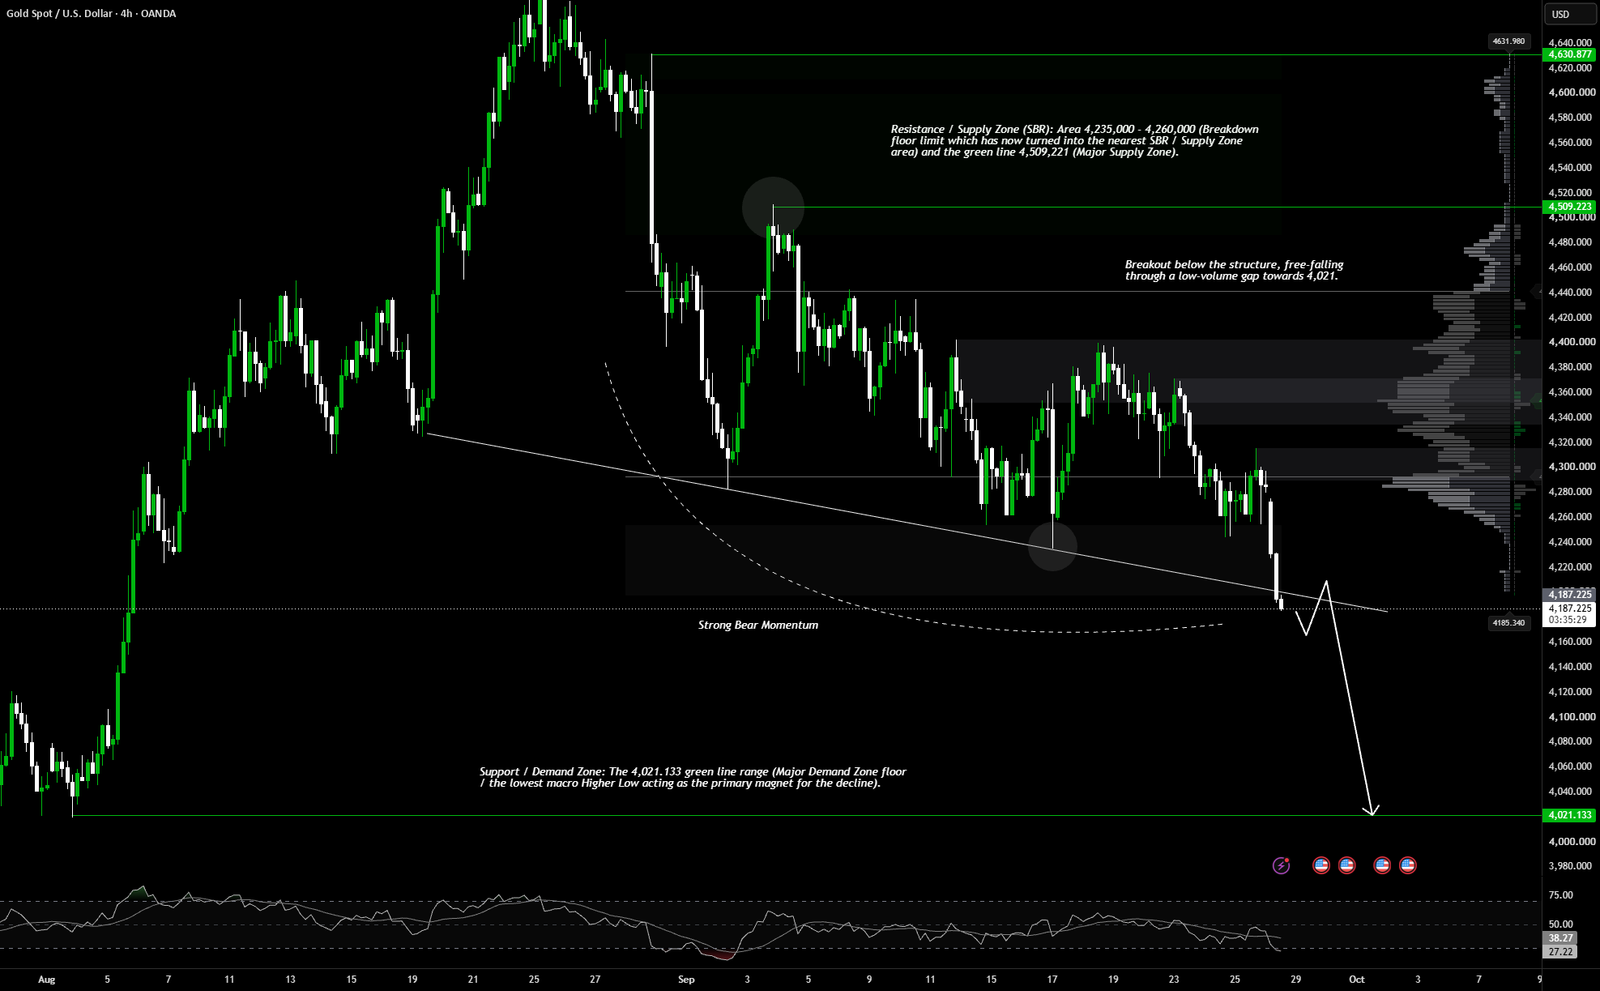
 XAUUSD
—————————————————————————————————————-
✅ US Monetary Policy & Analyst Reviews: Hawkish Rhetoric from 4 Fed Officials & OCBC/OANDA Projections
The US interest rate landscape is aggressively reinforcing the Greenback’s yield advantage:
⚡Tightening Signals from Beth Hammack & Michael Barr:
Cleveland Fed President Beth Hammack stated firmly on Friday that inflation risks remain high, necessitating the maintenance of a tight monetary policy. Fed Governor Michael Barr added that “further policy adjustments will likely be needed” to curb inflation. Similar sentiments were expressed by Richmond Fed President Tom Barkin and Boston Fed President Susan Collins.
⚡OCBC Quantitative Review (October Rate Hike Probability >70%):
Strategists at OCBC noted that Gold “dipped further below $4,250 before a slight overnight rebound,” as Middle East tensions drove oil prices higher, while “strong US data and hawkish Fed comments” kept expectations for tightening elevated.
—————————————————————————————————————-
✅ Price Action Analysis (H4 Timeframe)
The H4 structure clearly confirms a “Strong Bearish Breakdown” phase.
After forming a series of stacked Lower Highs (LH)—from the record peak of 4,630.877 to 4,509.221, followed by consolidation around the 4,350.000 level—gold finally breached the critical support floor at 4,235.000 with an impulsive vertical red candle (marubozu expansion).
At the 4,191.915 price level, the latest H4 candle is fully dominated by selling pressure, showing no significant lower-wick rejection (strong bearish close). The breach of this local support structure has triggered a macro-level Change of Character (CHoCH) or Break of Structure (BOS) to the downside.
—————————————————————————————————————-
✅ Key Zones:
– ⚡Resistance / Supply Zone (SBR): The 4,235.000 – 4,260.000 area (the breakdown level that has now shifted into the nearest SBR/Supply Zone) and the green line at 4,509.221 (Major Supply Zone).
– ⚡Support / Demand Zone: The vicinity of the green line at 4,021.133 (the floor of the Major Demand Zone / the lowest macro Higher Low, acting as the primary magnet for the decline).
—————————————————————————————————————-
✅ Elliott Wave Analysis
Mapping the wave cycle movements on the H4 timeframe:
⚡Wave Structure:
The decline from the 4,509.221 peak to 4,235.000 is calculated as Wave 1 (or Wave A). The sideways consolidation in mid-September is identified as the formation of the corrective Wave 2 (or Wave B).
⚡Current Status:
The vertical, impulsive drop breaking through 4,235.000 and touching 4,191.915 confirms that the market is currently in its most aggressive expansion phase: Wave 3 (Impulsive Wave 3).
⚡Projection:
Price action is projected to complete this impulsive Wave 3 push, moving past the LVN area and targeting a full test of the Major Demand Zone stronghold near the green line at 4,021.133.
 Bitcoin
  Ethereum
  Tether
  BNB
BNB  XRP
XRP  USDC
USDC  Solana
  TRON
TRON  Zcash
Zcash  Figure Heloc