

 XAUUSD capitalized on a mild rebound during the Asian trading session on Friday, September 18, 2026, while remaining below the week’s record highs.
—————————————————————————————————————–
✅ UOB Group: US Monetary & Quantitative Outlook – Fed’s New Rate Hike Cycle & December Bets (88%)
The US monetary landscape is reinforcing the Greenback’s dominance against G-10 and Asian currencies:
– ⚡UOB Group’s Exclusive Projection (DXY Reversal Catalyst): Analysts at UOB Group assert that the Federal Reserve’s return to a new rate-hike cycle fundamentally alters the US Dollar’s outlook. UOB notes: “As we now anticipate two additional Fed rate hikes, the narrowing of US interest rate differentials relative to G-10 nations—which had weighed on the DXY since late 2024—is likely to reverse and support the DXY going forward… We now see upside risks to our USD forecasts against both G-10 and Asian currencies.”
– ⚡CME FedWatch Probabilities: October (54%) & December (88%): The CME Group FedWatch Tool indicates that the market is pricing in a 54% probability of a rate hike at the October meeting, surging to 88% for a hike in December 2026.
– ⚡North American Session Catalysts Tonight: Market participants await the release of US Industrial Production and Capacity Utilization data, as well as speeches from influential Federal Open Market Committee (FOMC) members later today.
—————————————————————————————————————–
✅ Price Action Analysis (H1 Timeframe)
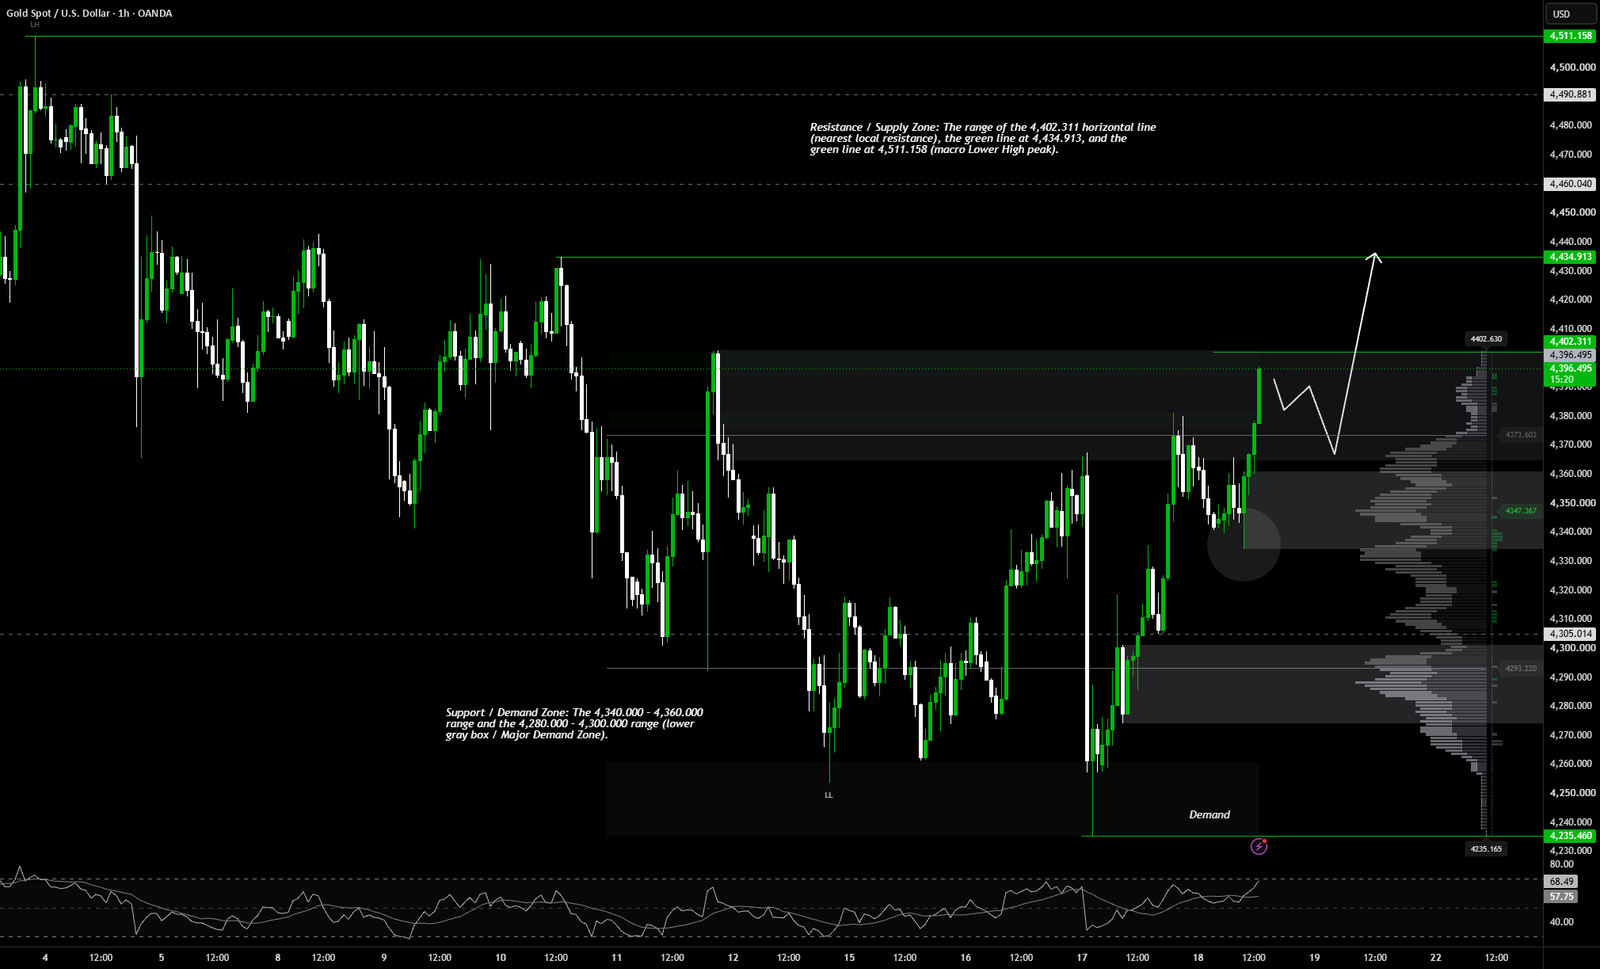
The H1 intraday structure confirms a transition from a bearish sell-off phase to a Bullish Reversal/Retest phase. After undergoing a liquidity sweep (a sharp spike) below the Demand floor—touching the green line at 4,235.460—gold launched an impulsive rally that successfully broke a series of local Lower Highs (LH) and established a new structure of Higher Highs (HH) and Higher Lows (HL).
At the 4,392.810 price level, the latest H1 candle is dominated by bullish movement pushing directly against the Resistance-Turned-Support (RBS) zone and the local Supply area within the 4,390.000 – 4,402.311 range (gray horizontal line).
The breakout above 4,380.000 indicates that buyers are in full control of intraday momentum.
—————————————————————————————————————–
✅ Key Zones:
– ⚡Resistance / Supply Zone: The range of the 4,402.311 horizontal line (nearest local resistance), the green line at 4,434.913 (upper gray box / Major Supply Zone), and the green line at 4,511.158 (macro Lower High peak).
– ⚡Support / Demand Zone: The 4,340.000 – 4,360.000 range and the 4,280.000 – 4,300.000 range (lower gray box / Major Demand Zone).
—————————————————————————————————————–
✅ Elliott Wave Analysis
Mapping the wave cycle movement on the H1 timeframe:
– ⚡ Wave Structure:
The impulsive rally from the 4,235.460 low toward the 4,380.000 range is calculated as Sub-Wave 1 (or Wave A). The corrective pullback to the 4,300.000 area is identified as the formation of Sub-Wave 2 (a micro zigzag correction).
– ⚡Current Status:
The impulsive green surge from the 4,300.000 level—currently hovering at 4,392.810—confirms the ongoing major expansion of the bullish impulsive Sub-Wave 3 (or Wave C).
– ⚡Projection:
Price action is projected to complete this Sub-Wave 3 thrust, breaking through the 4,402.311 horizontal line and crossing the LVN zone to target a test of the Major Supply Zone stronghold near the 4,434.913 green line.
 Bitcoin
  Ethereum
  Tether
  BNB
BNB  XRP
XRP  USDC
USDC  Solana
  TRON
TRON  Zcash
Zcash  Figure Heloc