

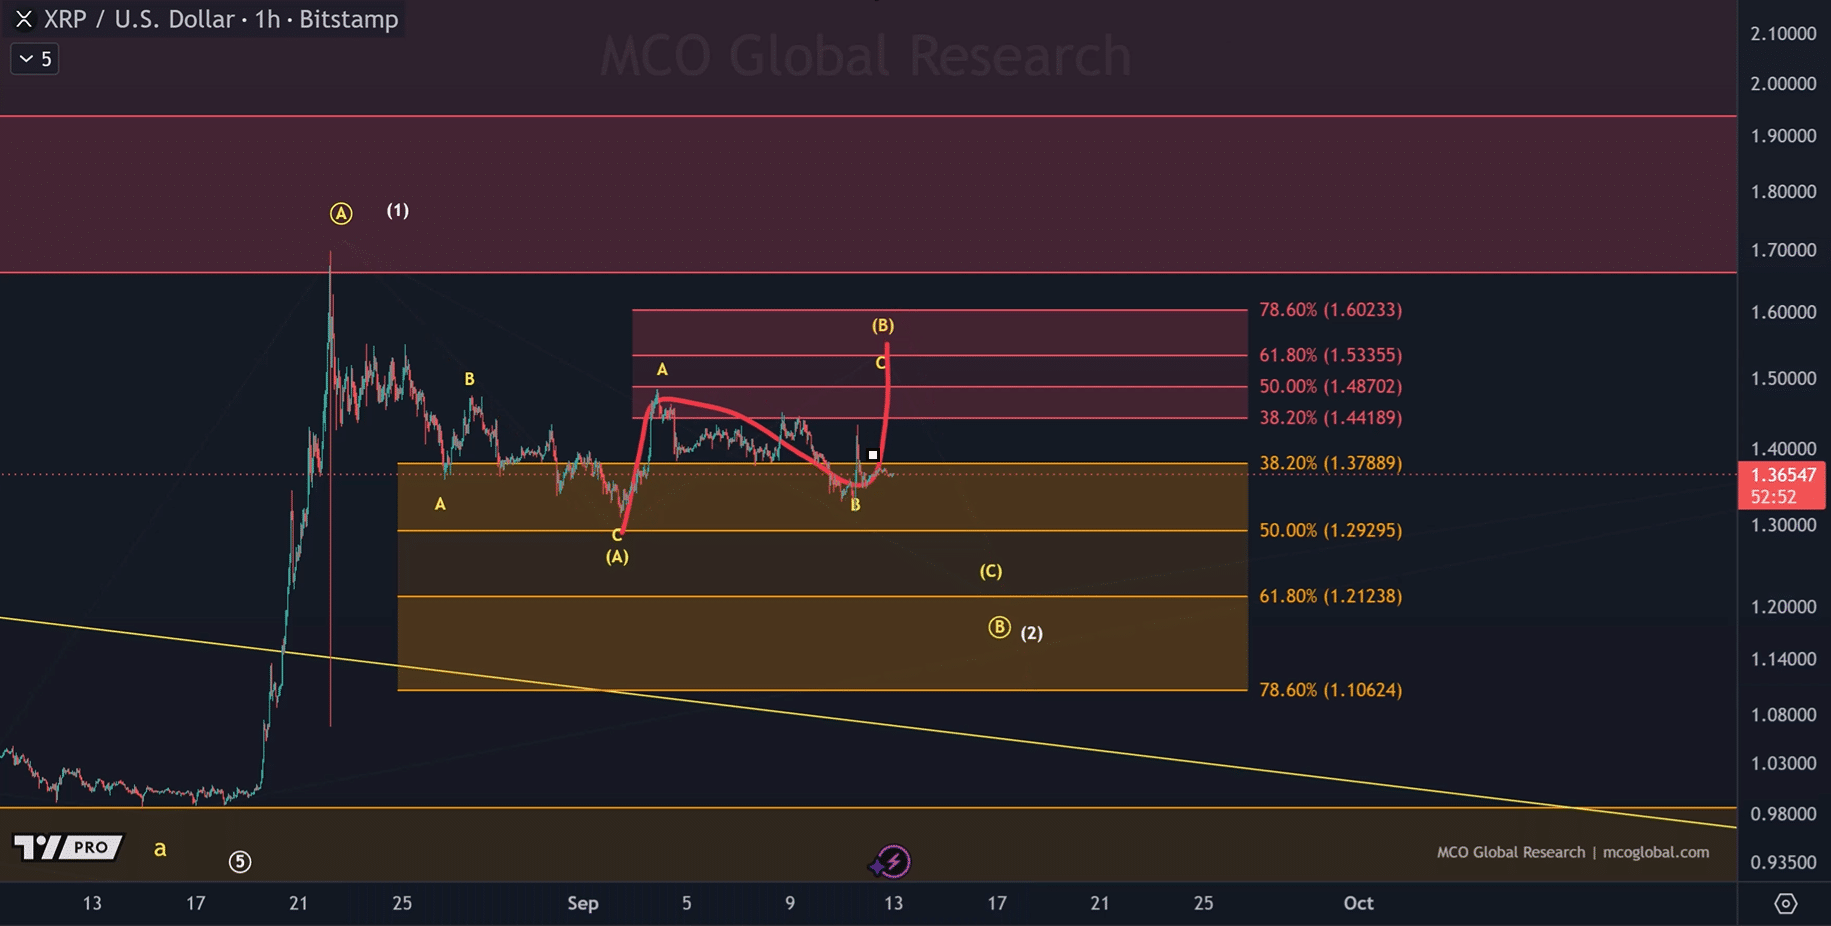
XRP could witness another decline before resuming its upward push, according to an Elliott Wave analysis of the 1-hour chart.
The structure suggests that the correction that followed XRP’s August 2026 rally may not be over yet, which leaves room for another decline before a possible move toward $2.25. XRP was trading near $1.37 at press time, sitting below its August high.
XRP’s August Rally May Not Yet Be Over
XRP rose 28.5% in August 2026, marking the strongest August performance since 2021. The token climbed from around $1.00 to nearly $1.70, and the rally also drew massive institutional interest.
Notably, US spot XRP ETFs attracted $150.28 million during the final two weeks of August, taking cumulative inflows to $1.68. However, much of this buying came after XRP had already posted an upward push, which left the token open to a pullback.
On the hourly chart, XRP reached a high of about $1.69 in August, just below the major resistance area between $1.90 and $2.10.
The Elliott Wave count treats this rise as Wave 1, which represents the first major move in a larger uptrend. With this structure, Wave 1 normally leads to Wave 2, a correction that gives back part of the earlier gains. XRP’s September decline fits a possible Wave 2 pattern, with the price now near $1.38.
XRP Correction Could Have Another Leg
The broader Wave 2 correction contains a smaller A-B-C pattern. Within the structure, Wave A reached a low near $1.29, while Wave B later pushed XRP back up to around $1.53.
XRP has since fallen toward the $1.37889 Fibonacci level, which the chart identifies as a possible B-wave position within a final C-leg pattern. The lack of a clear upward impulse from a recent low suggests that the correction may still have more room to run.
Based on this, XRP could first recover toward the $1.53-$1.62 area before falling again and completing Wave 2. This means the token could experience another short-term rebound before making a final move lower instead of immediately starting a sustained rally.
$1.10 Remains the Crucial Level
Three Fibonacci levels below the current price now mark the main support area for a possible Wave 2 bottom. The first is $1.29295, which represents the 50% retracement and sits close to the earlier Wave A low. The next level is $1.21238, which marks the 61.8% retracement.
The lowest level is $1.10624, representing the 78.6% Fibonacci retracement. Together, $1.29, $1.21, and $1.10 make up the orange support zone shown on the chart, where Wave 2 could potentially find its bottom.
The $1.10 level remains especially important for the bullish setup. As long as XRP avoids closing below this level, the potential Wave 3 setup remains valid. However, a break below $1.10 would weaken the current Elliott Wave count.
Wave 3 Could Target $2.25
If XRP completes Wave 2 within the $1.10-$1.38 support area and then produces a strong upward impulse, the next major target could sit between $1.93 and $2.25. The chart places this range as the potential target for Wave 3, which often becomes the strongest move within an Elliott Wave sequence.
The existing resistance area between $1.90 and $2.10 also falls within this projected target range, which makes it an important area to watch.
However, it is difficult to set a precise Wave 3 target until XRP confirms where Wave 2 ends. A bottom near $1.29 would produce a different projection from a bottom near $1.10.
Other market signals also support this outlook. Prediction markets currently point to $1.60 as the most likely September outcome for XRP, while a drop toward $1.20 remains a notable alternative. The latter sits close to the $1.21238 61.8% Fibonacci retracement.
 Bitcoin
  Ethereum
  Tether
  BNB
BNB  XRP
XRP  USDC
USDC  Solana
  TRON
TRON  Figure Heloc
  Zcash
Zcash 