



Bitcoin is trading below below $78,000 as weakening demand from US spot exchange-traded funds (ETFs) collides with a buildup of leveraged positions that could deepen selling if key support levels fail.
Data from CryptoSlate showed that the largest digital asset trades near $77,400 after briefly clearing $82,000 earlier this month. The retreat came following a more cautious macro backdrop, with traders weighing speculation about a possible US-Iran agreement and its impact on risk assets.
However, market analysts point to a deeper structural imbalance within cryptocurrency exchanges that could dictate Bitcoin’s near-term trajectory.
Data from Alphractal showed about $14.3 billion in potential liquidation pressure around Bitcoin’s current level.
According to the firm, the total is split across bullish and bearish positions, but the distribution is uneven. Long liquidations are concentrated in a tighter range below current spot levels, while short liquidations are spread across higher price levels.
Liquidation pressure builds below spot
The most immediate risk sits in the derivatives market, where leveraged long positions have accumulated near several downside levels.
Alphractal’s aggregated liquidation heatmap showed $1.61 billion in resting long liquidity near $73,716, and the cumulative figure rises to $3.85 billion around $73,281.
This volume scales rapidly, reaching $5.42 billion at $72,702 and culminating at $7.14 billion if the asset touches $72,122.
This structural setup means a downward move of 6% to 7% could initiate a concentrated liquidation cascade, as exchanges automatically sell underlying collateral to close out leveraged accounts.
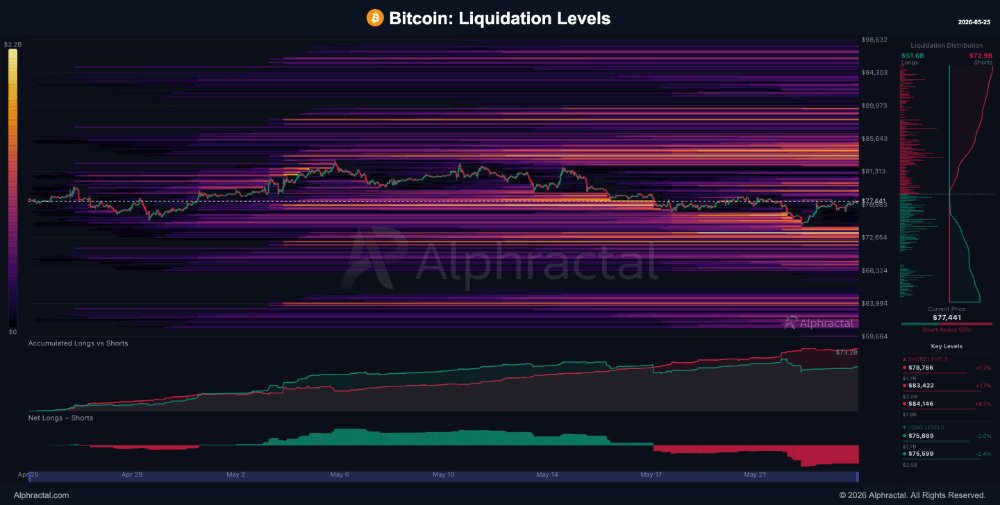
In contrast, the pressure from short sellers is notably less concentrated. An upward move to $78,786 would liquidate $1.66 billion in short positions, but the subsequent thresholds are further apart.
Cumulative short liquidations would not reach $3.68 billion until the price hits $83,422, and it would take a rally to $88,202 to clear $7.20 billion in short contracts.
Market analysts observe that this specific structure typically results in downward price movements accelerating faster than upward recoveries, as the densely packed long positions create localized pockets of forced selling.
Indeed, leveraged longs have already taken most of the recent damage. Over the weekend, CryptoSlate reported that long traders lost roughly $870 million after Bitcoin’s price briefly dropped below $75,000 for the first time since mid-April.
ETF outflows weaken Bitcoin’s institutional bid
This leverage risk is amplified by a distinct lack of spot market demand to absorb potential selling.
This is evident in the US spot Bitcoin ETFs which have recorded about $2.26 billion in net outflows over a two-week period after Bitcoin briefly moved above $82,000. The withdrawals pushed ETF holdings back into decline and interrupted a recovery that had been helping stabilize the market.
Ecoinometrics, a Bitcoin-focused analysis platform, said the demand trend had continued to weaken even though Bitcoin’s price had not yet fully adjusted.
The firm said rolling 30-day ETF flows had returned to negative territory, a signal that institutional demand was no longer providing the same support seen during the earlier rebound.
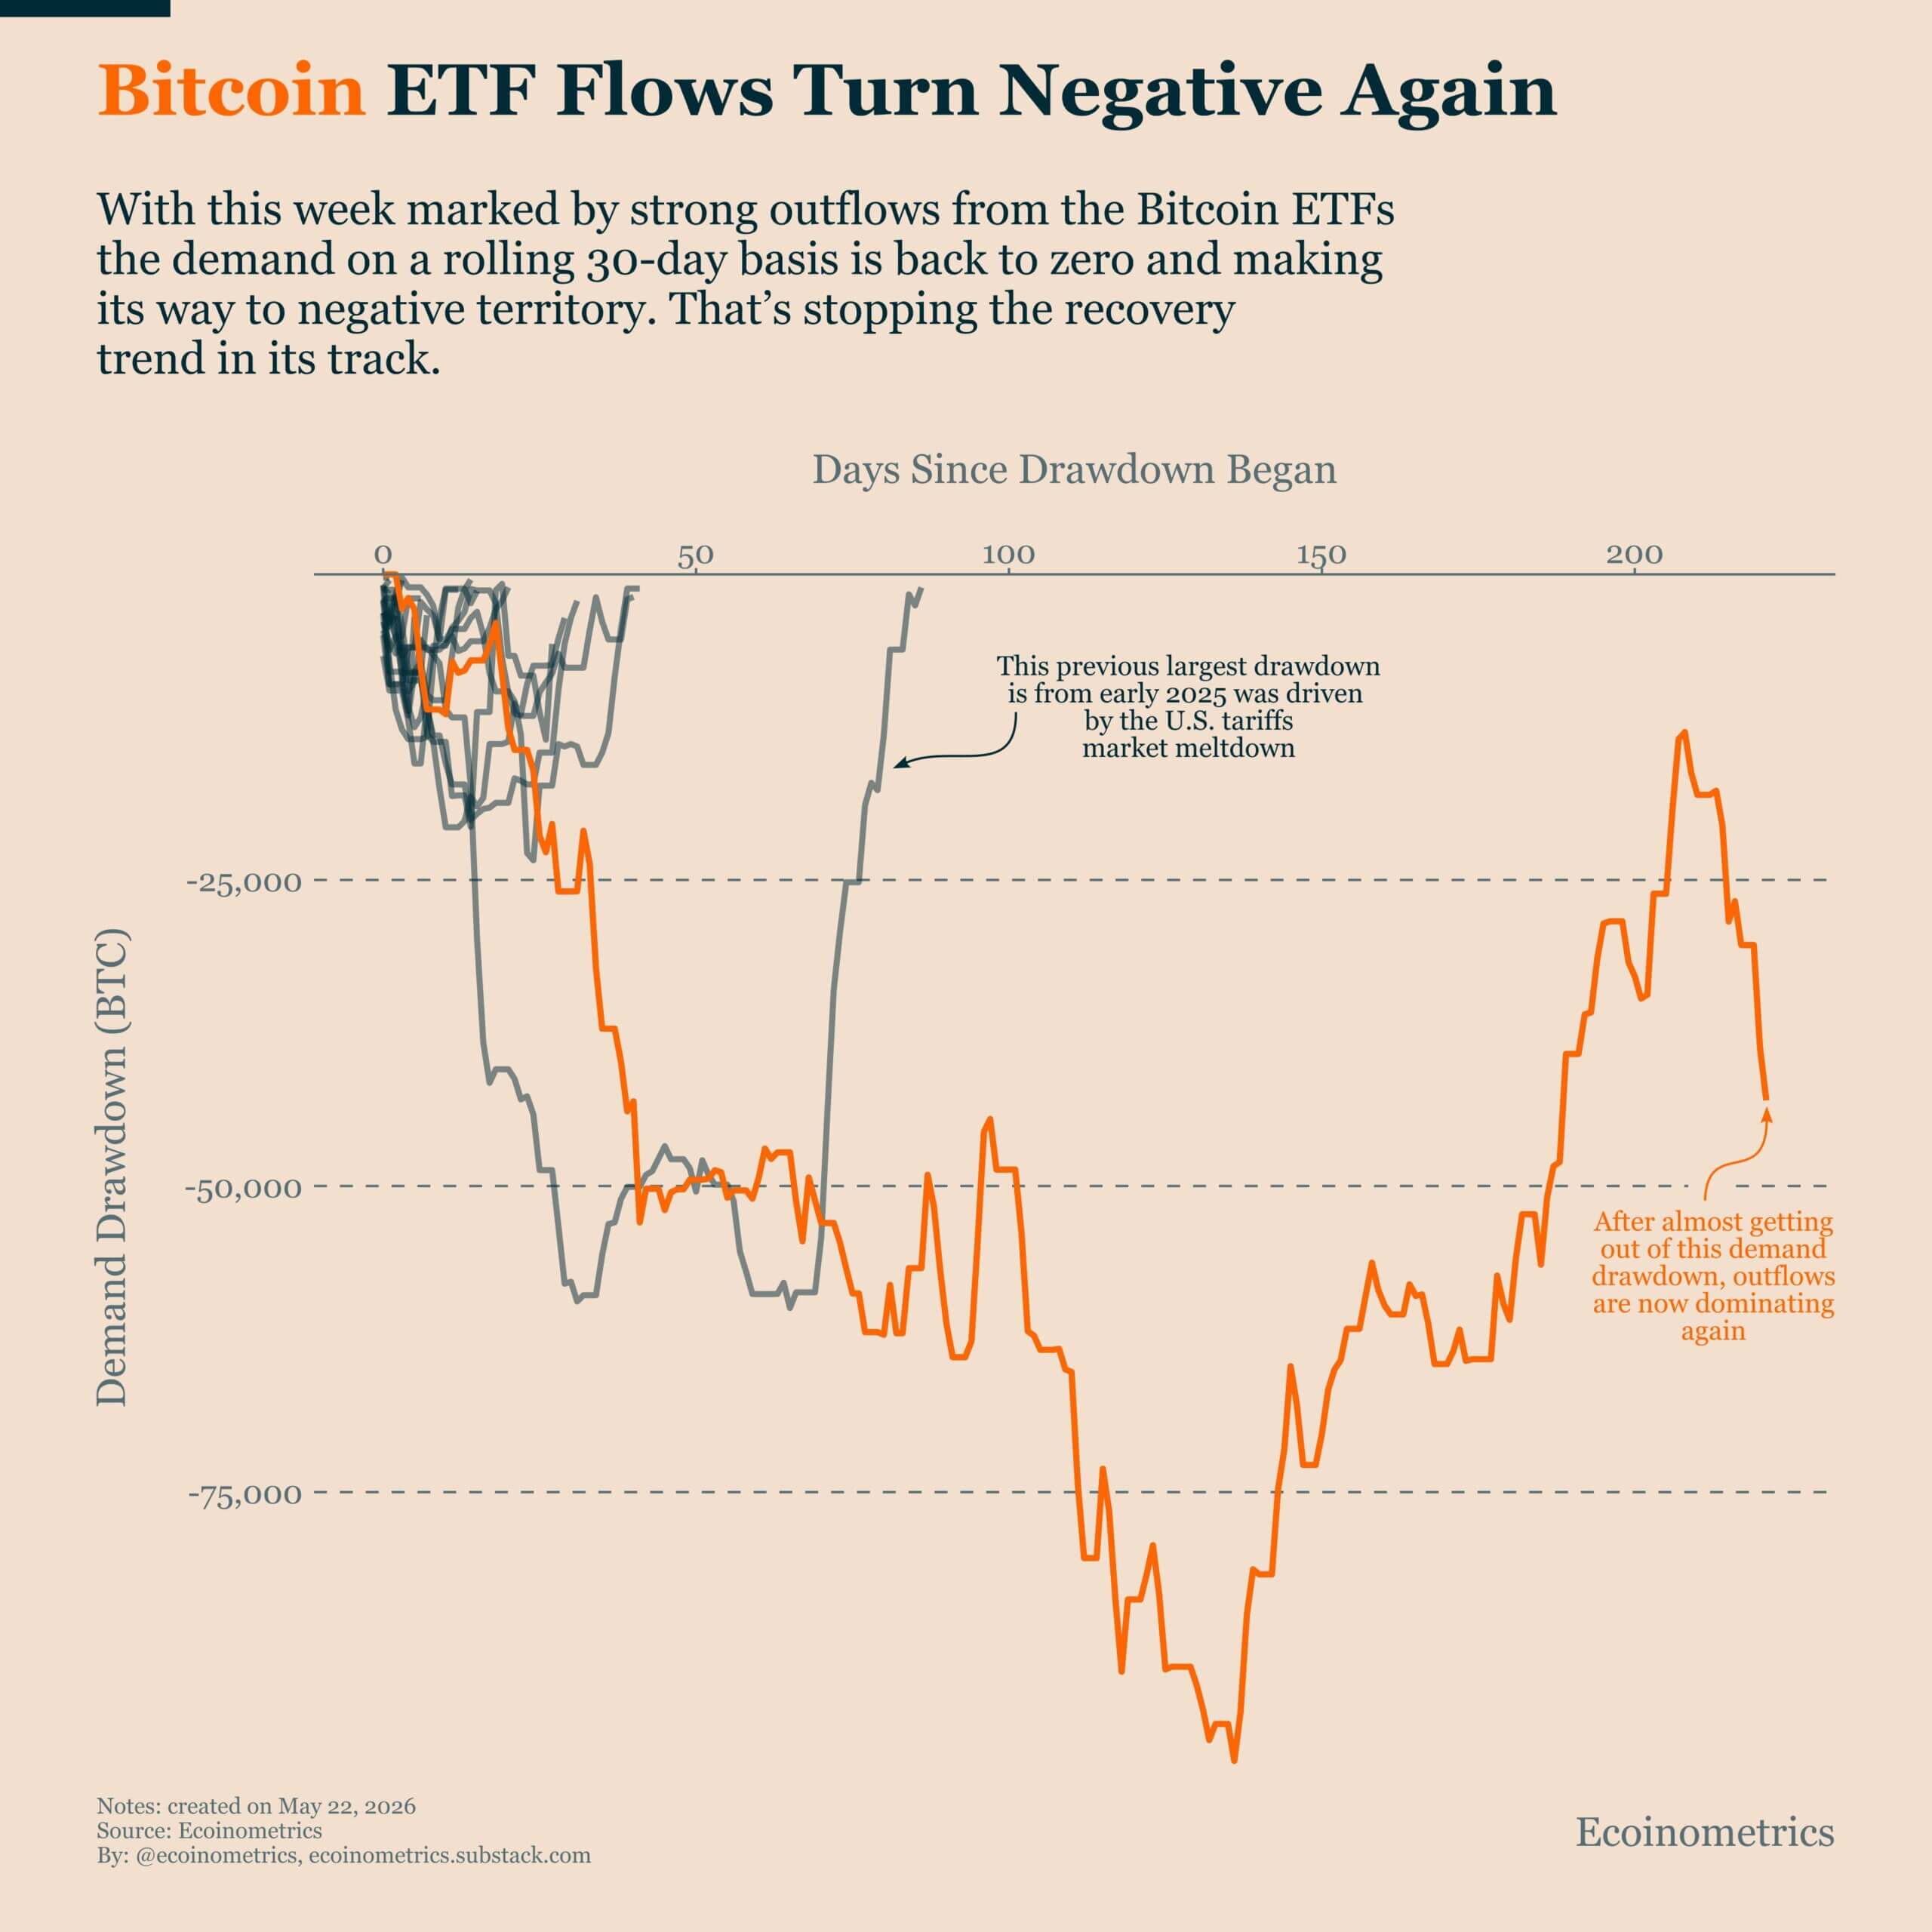
ETF flows have become one of the clearest measures of marginal demand for Bitcoin since the funds launched. When inflows are strong, they provide steady spot buying and help absorb selling from traders and miners. When outflows persist, the market loses a major cushion.
This institutional decline is mirrored across broader on-chain demand metrics.
According to data provider CryptoQuant, Bitcoin’s “Apparent Demand” has plunged to -147,000 BTC, its weakest level since the start of the year. The metric compares new Bitcoin issuance with supply that has remained inactive for more than one year, offering a way to estimate whether long-term accumulation is strong enough to absorb new supply.
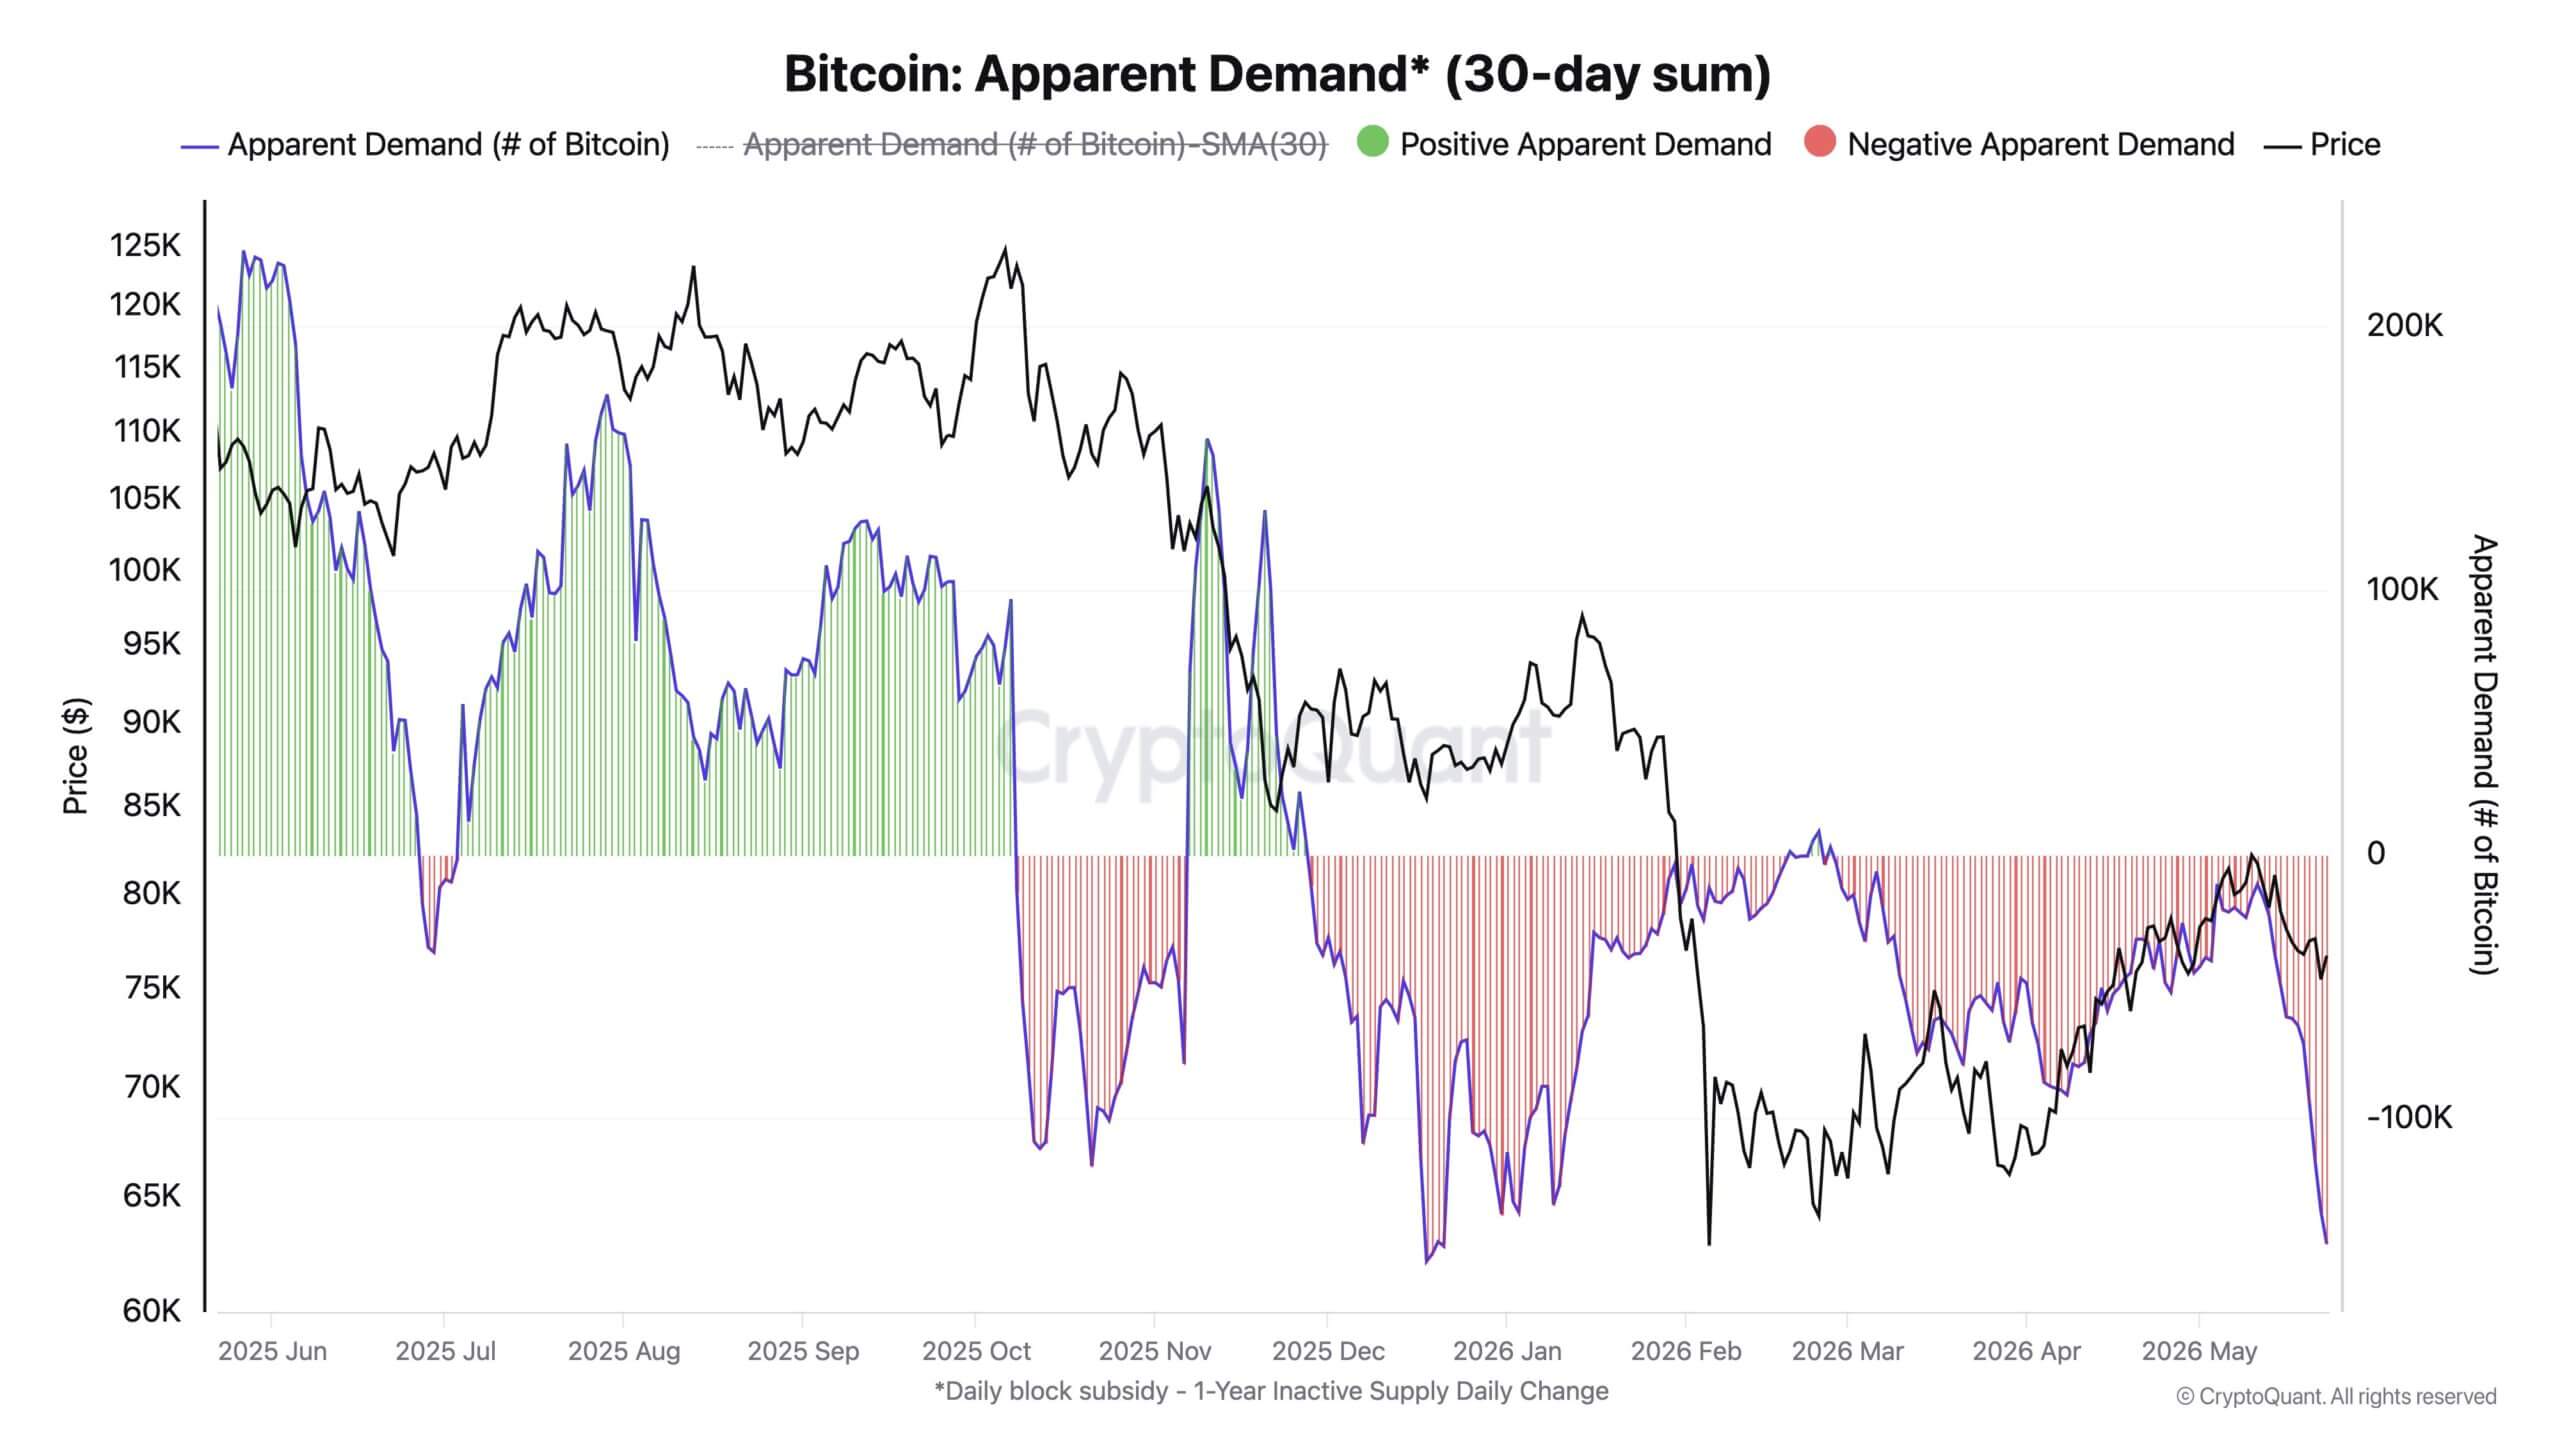
The data reflects an uncomfortable reality for digital asset bulls: while derivatives and futures speculation can amplify short-term upward momentum, a sustainable, durable bull market requires genuine spot accumulation. Without it, the market lacks a solid foundation.
Compounding this demand deficit is a steady drain of stablecoin liquidity. CEX.io noted that stablecoins on exchanges registered a daily average net outflow of -$332 million over the past week.
This indicates that sidelined capital, which is the digital dollar liquidity typically utilized by traders to buy market dips, is actively leaving trading platforms. As a result, the market becomes highly vulnerable to supply shocks.
Short-term holders lose their profit cushion
As capital exits the ecosystem, short-term investors are bearing the brunt of the pain.
A May 25 note from CEX.io showed that short-term Bitcoin holders went from being marginally profitable to deeply underwater in less than seven days. Short-term BTC holders are defined as entities holding the coins for less than 155 days.
According to the company, this cohort’s realized profit-and-loss profile deteriorated at a pace similar to that seen during the stressed weeks in January and February.
Notably, this group of investors often reacts quickly when prices fall below cost basis. This is because they typically have less tolerance for drawdowns than long-term holders, making them more likely to sell when a rebound fails or when losses deepen.
More critically, a fundamental structural shift has occurred on the charts. Bitcoin’s short-term holder cost basis has crossed below the asset’s “true mean price,” a long-term valuation anchor.
Historically, this specific technical crossover has served as a severe macro warning pattern. In previous market cycles, this exact event occurred in the middle of broader bear markets, serving as the immediate precursor to a major leg down.
In 2014, a similar crossover came before a 20% weekly drop. In 2018, it preceded a 21% weekly decline. In 2022, the signal appeared ahead of a 34% weekly decline.
The current cycle has shown lower volatility, making a repeat of those moves less likely. However, the signal still shows that recent buyers are underwater relative to a longer-term valuation anchor.
That can weaken support because falling prices push more holders into losses, increasing the risk of additional selling.
If the historical pattern were to repeat more fully, Bitcoin could face pressure toward the $60,000 area. A milder outcome would still leave the market vulnerable unless buyers quickly reclaim the upper-$70,000 range.

Whale buying offers a counterweight
Despite the overarching bearish indicators, a stark divergence is emerging between institutional retail channels and long-term crypto natives.
While the Crypto Fear & Greed Index has plunged into “Panic” territory with a reading of 28, large-scale BTC holders, known as whales, are aggressively capitalizing on the discount.
CEX.io noted that these long-term holders added about 30,000 BTC last week, extending an accumulation trend that has continued for months.
While the pace slowed from roughly 80,000 BTC the previous week and from the larger additions seen in April, the direction still shows that some longer-duration investors are buying into weakness.
Alphractal also cited on-chain cohort data showing that addresses holding at least 1,000 BTC accumulated 47,000 BTC over the past 14 days.
Evidence of this can be seen through BTC treasury firm Strategy which added 24,869 BTC last week for about $2.01 billion at an average purchase price of $80,985.
The whales appear to view the current Bitcoin decline as a mechanical, programmatic portfolio rebalancing rather than a fundamental rejection of cryptocurrency.
Much of this contrarian optimism is tied to legislative developments in Washington where US lawmakers recently advanced the CLARITY Act. This is a piece of legislation widely expected to provide definitive regulatory guardrails for digital assets in the United States.
Essentially, the arge buyers are effectively gambling that the legislative outlook will ultimately override near-term spot market weakness.
This optimism is unsuprising considering their underlying sentiment metric, which weights investor conviction by holding duration, has climbed to 0.82.
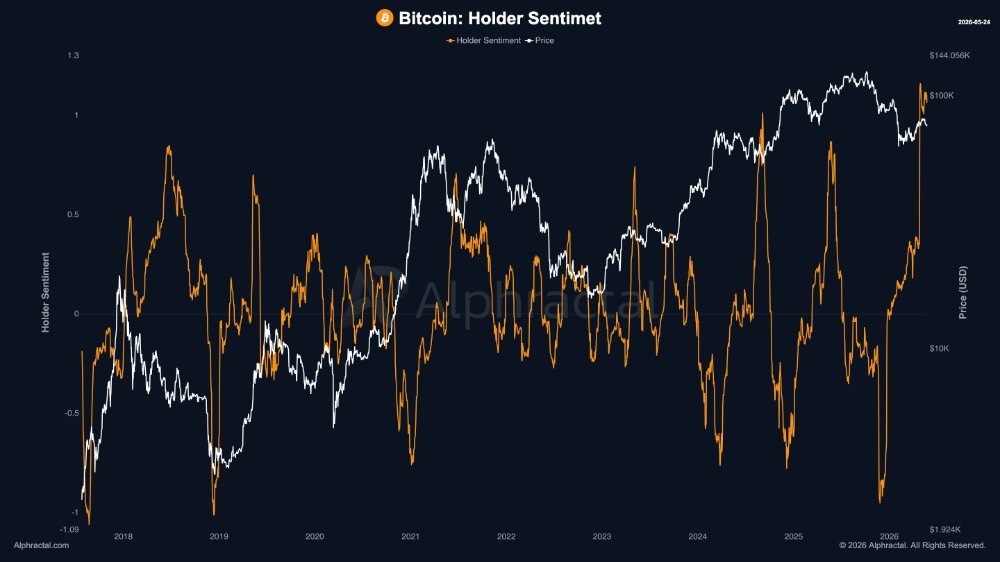
Historically, whenever this metric surpasses the 0.80 threshold during a retail panic where the Fear & Greed index sits below 30, it has signaled an impending cyclical bottom.
The last time this precise setup occurred was in March 2024, after which Bitcoin staged a 67% rally over the following 90 days.
What Bitcoin traders are watching next
In the immediate term, the technical and structural path of least resistance for Bitcoin appears skewed to the downside.
Funding rates in the derivatives market have flipped mildly positive, indicating that the aggressive short-selling positions that dominated throughout the spring have completely unwound.
While this sounds positive, it removes the possibility of a “short squeeze” as a near-term upward catalyst.
For bullish traders to reclaim control and stabilize the market, they face a steep uphill battle.
BTC buyers must rapidly push the spot price back above the dual resistance of the short-term holder cost basis and the true mean price, both currently converging around $78,000. Succeeding there would open the door for a test of the critical 200-day moving average at $80,000.
However, if this overhead resistance cannot be claimed in the coming days, the macro technical picture will likely darken, reinforcing the deeper correction signaled by historical cycles.
For market bears, the immediate objective remains $74,500, where the 128-day moving average is positioned.
A clean, decisive break below that support level would strip away Bitcoin’s final near-term defensive line, likely validating the compressed $14 billion liquidation trap below and re-establishing a harsh downward momentum not felt by the market since February.

 Bitcoin
  Ethereum
  Tether
  BNB
BNB  USDC
USDC  XRP
XRP  Solana
  TRON
TRON  Figure Heloc
  Hyperliquid