- Bitcoin price is experiencing a pullback after rallying 38% to tag $40,000.
- Ethereum price promptly follows BTC as it eyes a retracement to the $2,018 support level.
- Ripple price might revisit the demand zone extending from $0.547 to $0.568 before a new leg-up.
Bitcoin price rallied exponentially based on rumors, which pushed it beyond $40,000 for the first time in roughly 40 days. This bullish move affected a majority of the altcoins, including Ethereum and Ripple, which followed suit.
Now, a correction to offset the massive uptrend is likely before BTC decides to head on another similar run-up.
Bitcoin price looks for a foothold
Bitcoin price sliced through the $40,000 psychological level to create a swing high at $40,550 on July 26. This move constitutes a 38% upswing from $29,279 that sliced through the intermediate barriers.
Therefore, investors can expect a minor pullback to $34,666, a breakdown of which could knock BTC down to $33,185, a roughly 10% correction from the current position.
In some cases, the $32,435 support barrier is where the trend reversal could begin.
Investors need to note that a spike in buying pressure that restarts the pump from its current position is also plausible. In this case, Bitcoin price might set up a swing high above $40,550.
BTC/USDT 12-hour chart
While this narrative seems likely, things could awry if the selling pressure continues to build up, pushing BTC to produce a decisive 12-hour candlestick close below $32,435.
Ethereum price sweeps crucial swing highs
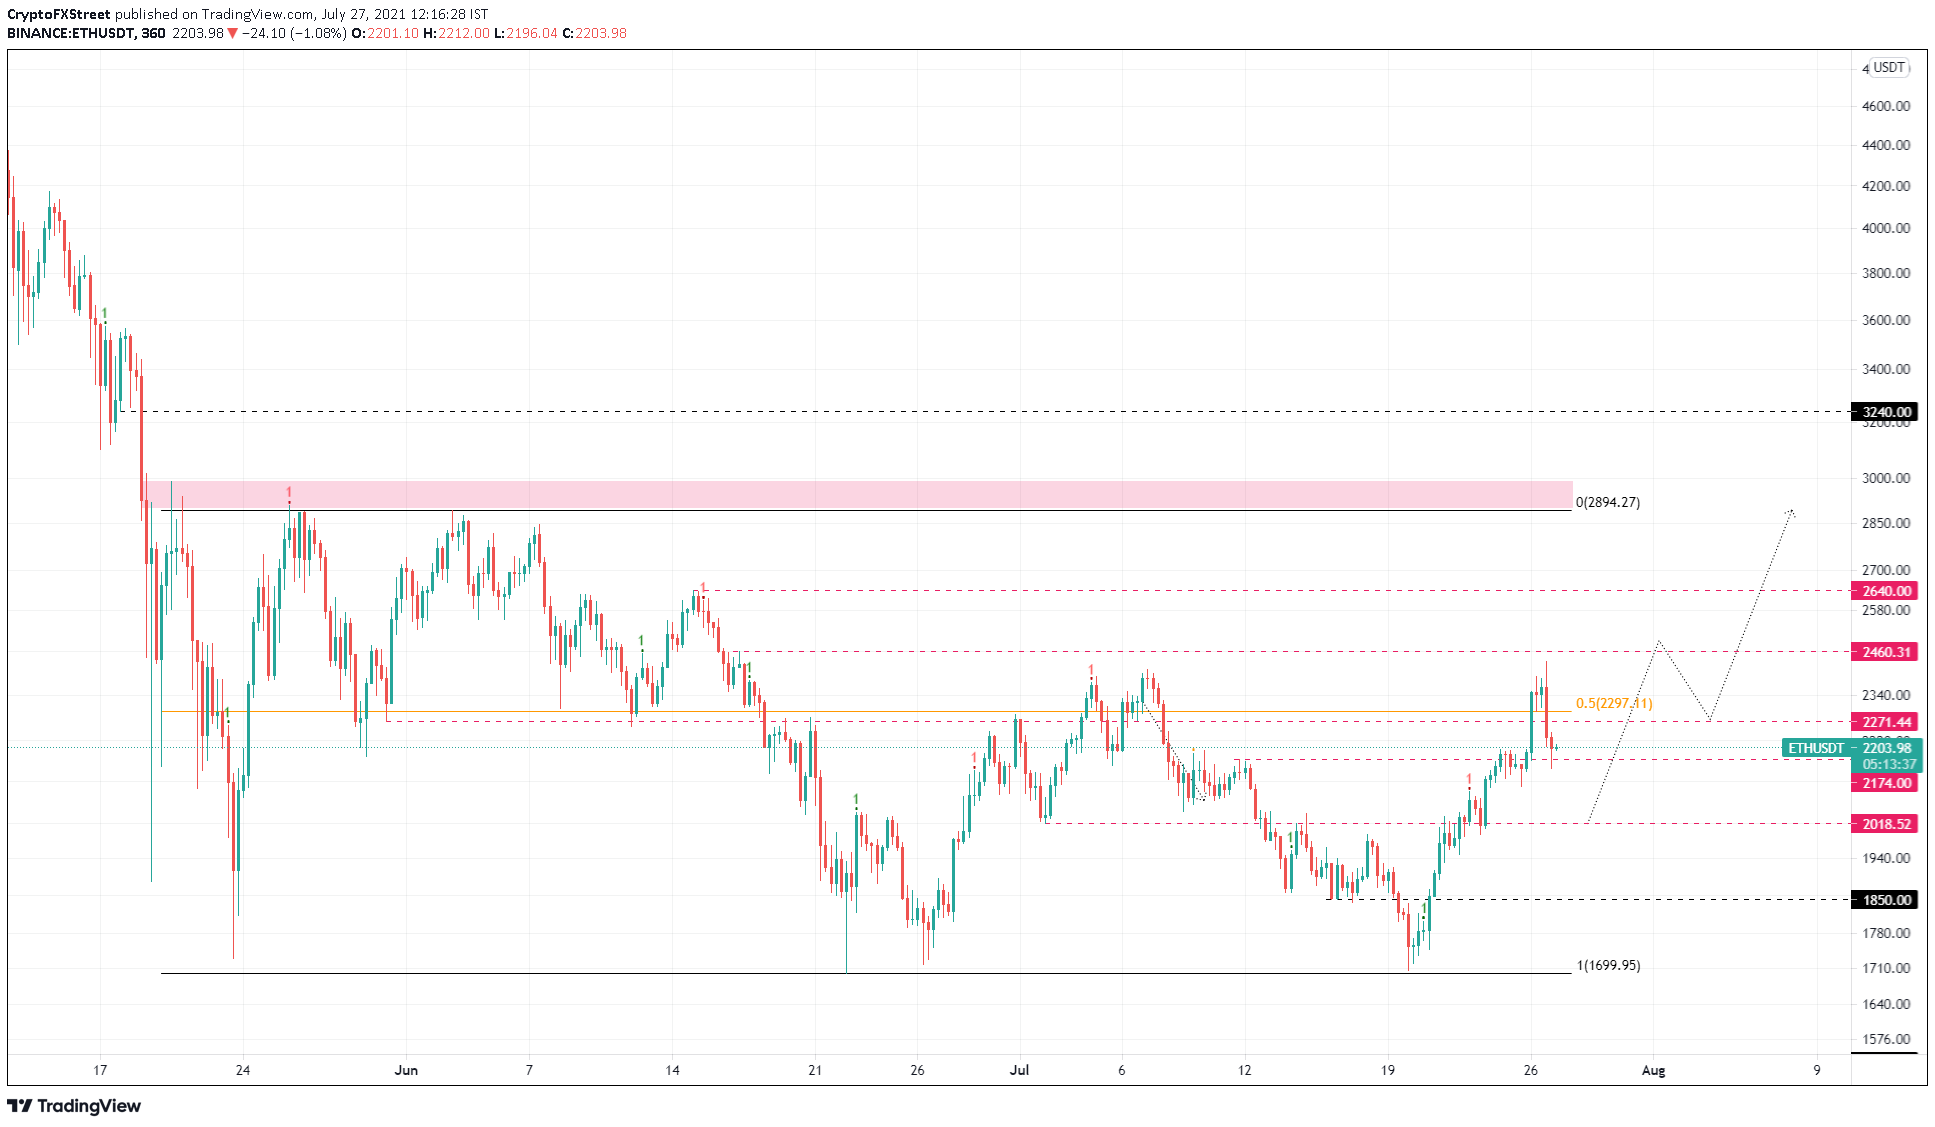
Ethereum price rallied 42% and swept the July 7 swing high at $2,409. This move collected liquidity present in the form of buy stops. This development allows the market makers to book profits, which will lead to a pullback.
The support level at $2,018, roughly 8% from the current position at $2,195, is the perfect foothold for restarting the upswing.
A resurgence of buying pressure at this point could push Ethereum price to $2,460 and, in a highly bullish case, $2,640 and the range high at $2,894.
ETH/USDT 12-hour chart
Regardless of the bullish nature of the Ethereum price structure, the optimistic narrative will face invalidation if the selling pressure pushes ETH to shatter the $2,018 demand barrier.
Ripple price awaits a trigger to kick-start an uptrend
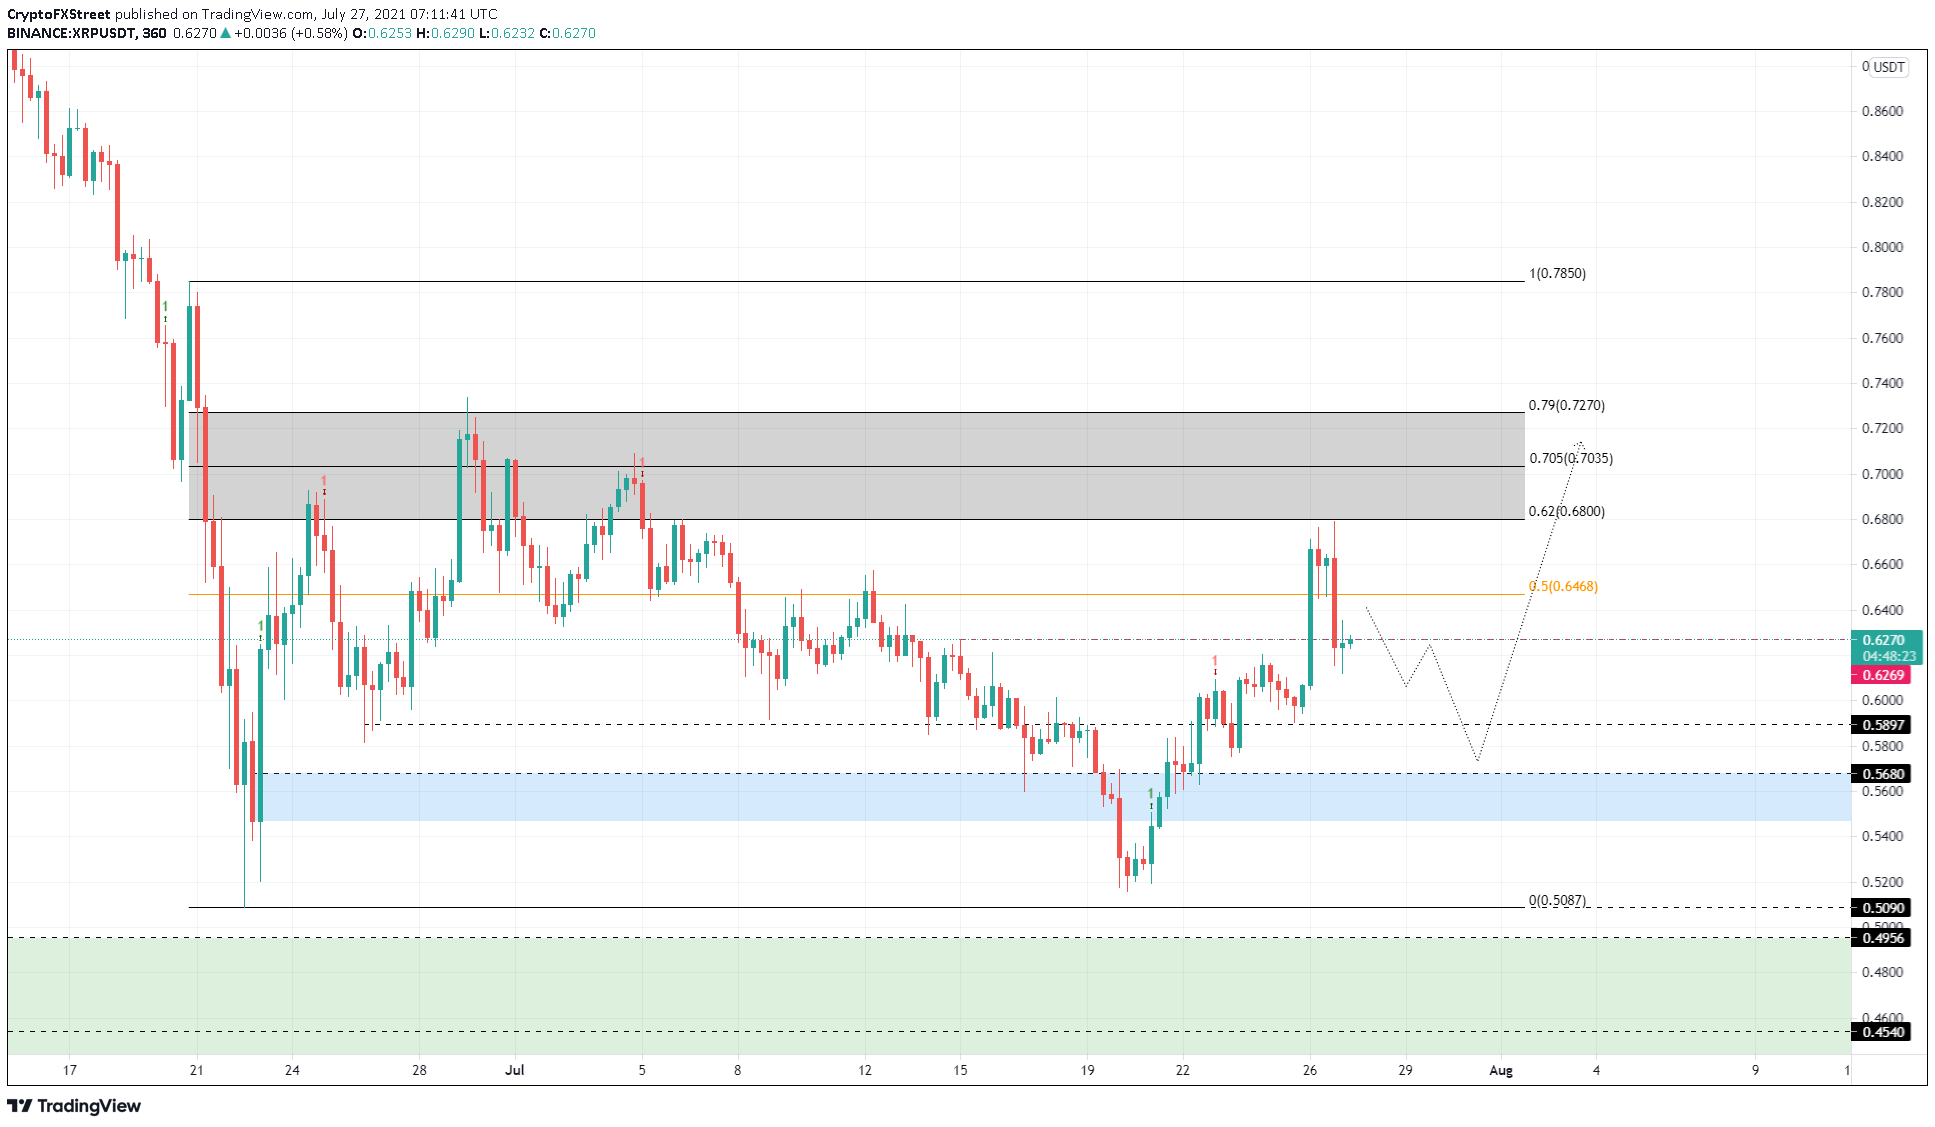
Ripple price came extremely close to tagging the 62% Fibonacci retracement level at $0.68 after rallying 31% from the July 20 swing low at $0.516.
Regardless, this run-up is overbought and is likely to correct to a crucial support level before the buyers band together, taking a jab at piercing the high probability reversal zone extending from $0.68 to $0.727.
The demand zone, extending from $0.547 to $0.568, seems like a better option for reversal due to the large range. However, investors need to note that the XRP price could also revert from the $0.59 support level.
XRP/USDT 6-hour chart
On the other hand, if XRP price produces a 6-hour candlestick close below $0.547, it will invalidate the bullish thesis and open the possibility of a retest of the range low at $0.509.


 Bitcoin
  Ethereum
  Tether
  XRP
XRP  Solana
  Dogecoin
  USDC
USDC  Lido Staked Ether
  Cardano