

Bitcoin is flashing renewed stability this month, backed by a notable seasonal pattern, as it has never posted back-to-back losses in January and February.
Key Points
- Bitcoin has fallen 12.55% in February, following a 10.16% drop in January, testing a long-standing seasonal pattern.
- Historically, February has rebounded after a losing January (observed in 2015, 2016, 2018, 2019, 2022).
- Extreme pessimism prevails: the crypto Fear & Greed Index hit 5 (lowest ever), and Bitcoin’s RSI at 15 signals oversold conditions.
- Short positions totaling $5.45 billion could be liquidated if Bitcoin rises to around $10,000, potentially triggering a short squeeze.
- Bitcoin trades well below the 50-day ($87K) and 200-day ($102K) moving averages, limiting immediate upside.
- Key support levels remain near $60K, with longer-term Fibonacci levels around $57K–$42K guiding potential downside.
Historical Trends Put February in Focus
For context, Bitcoin is currently trading near $68,789, marking a 12.55% decline so far this month. Meanwhile, January also ended with losses, as Bitcoin fell 10.16% over the month.
Consequently, this consecutive weakness has drawn close attention from traders because it stands in contrast to past behavior. Historical data shows that whenever Bitcoin finished January in the red, February typically brought gains. Years such as 2015, 2016, 2018, 2019, and 2022 clearly illustrate this pattern.
Therefore, February has become a pivotal test. A second consecutive monthly loss would mark the first instance of declines across both months, thus breaking a long-standing seasonal tendency.
Short-Term Price Action Shows Early Stabilization
Against this backdrop, Bitcoin briefly climbed above $71,000 on Monday, following a sharp dip in market sentiment. This bounce coincided with extreme pessimism across the crypto sector, a condition that often precedes short-term stabilization.
In this context, some market participants argue that elevated fear levels could help Bitcoin defend the $60,000 region, widely regarded as a key annual support level. However, others caution that weak liquidity and bearish positioning in futures markets may cap any near-term upside.
Extreme Fear Highlights Oversold Conditions
Sentiment indicators now sit at levels rarely seen. Michaël van de Poppe, founder of MN Capital, highlighted that the Crypto Fear & Greed Index dropped to 5 — its lowest reading on record. Meanwhile, Bitcoin’s daily relative strength index fell to 15, signaling exhaustion.
Van de Poppe compared current conditions to those seen during the 2018 bear market and the March 2020 COVID-19 crash. Based on these parallels, he suggested Bitcoin could stabilize and attempt a recovery without immediately retesting the $60,000 level.
Liquidation Data Favors an Upside Squeeze
Beyond sentiment, derivatives data offer additional support for a rebound scenario. Figures from CoinGlass show that approximately $5.45 billion in short positions would be liquidated if Bitcoin rises by around $10,000.
In comparison, a move back to $60,000 would trigger about $2.4 billion in liquidations. This imbalance suggests upward price movement could force short sellers to close positions, potentially accelerating a rally through a short squeeze.
Indeed, such liquidation dynamics often play a decisive role during periods of heightened volatility.

Technical Structure Remains a Limiting Factor
Despite supportive seasonal and sentiment signals, Bitcoin’s broader technical structure remains weak. Data from CryptoQuant shows the asset trading well below key moving averages.
The 50-day moving average stands near $87,000, while the 200-day average is close to $102,000. This wide separation reflects an ongoing corrective phase following the previous rally.
Additionally, CryptoQuant’s Price Z-Score stands at -1.6, indicating Bitcoin is trading below its statistical mean. Historically, similar setups have often led to extended consolidation periods rather than immediate trend reversals.
Derivatives Markets Signal Continued Caution
Derivatives activity further underscores ongoing caution. Crypto analyst Darkfrost noted that monthly net taker volume dropped sharply to -$272 million.
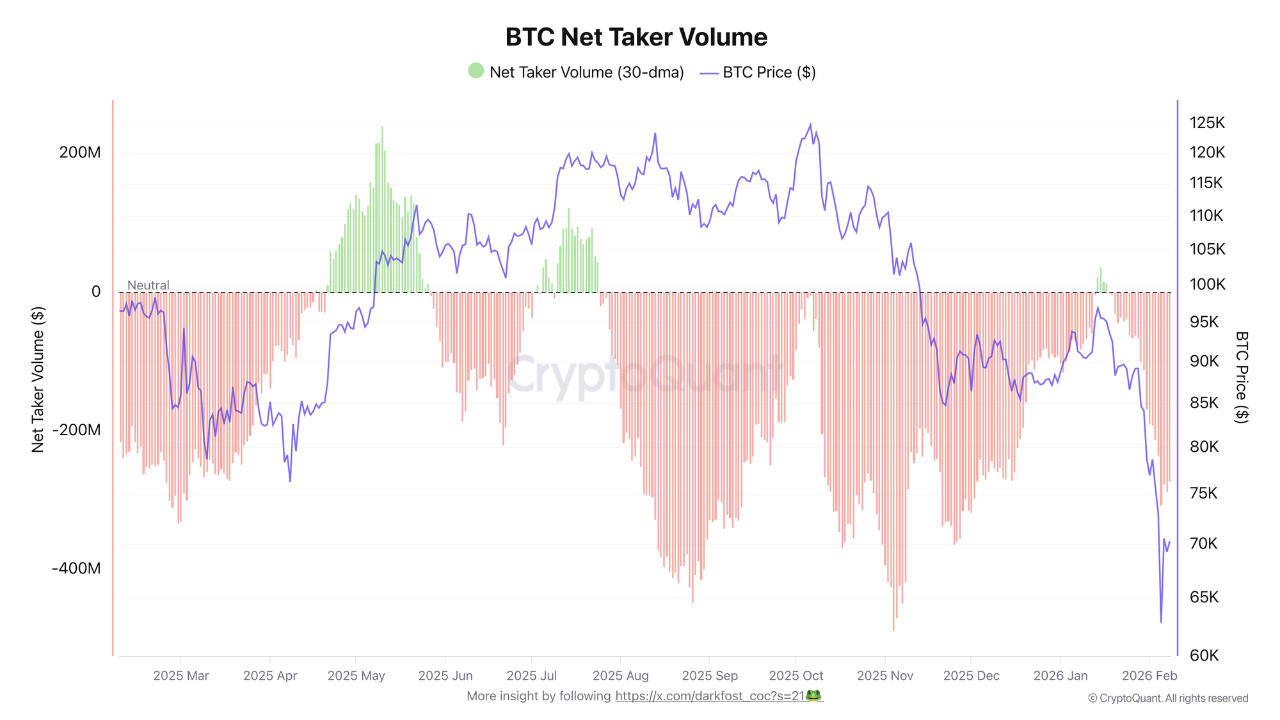
Meanwhile, Binance’s taker buy-sell ratio fell below 1, indicating that selling activity is currently outpacing buying interest. Futures volumes continue to outweigh spot market activity, suggesting that sustained upside may require renewed spot demand. Until that shift materializes, recovery attempts could remain fragile.
Longer-Term Levels Stay in Focus
Looking beyond the near term, Bitcoin investor Jelle pointed to historical behavior around Fibonacci retracement levels. Specifically, in prior cycles, bear market bottoms frequently formed below the 0.618 retracement level.
In the current cycle, that level is positioned near $57,000, with deeper downside projections extending toward $42,000 if historical patterns repeat. For now, however, these levels serve as longer-term reference points rather than immediate targets.
As February unfolds, attention remains fixed on whether Bitcoin can uphold its historical tendency toward recovery.
DisClamier: This content is informational and should not be considered financial advice. The views expressed in this article may include the author’s personal opinions and do not reflect The Crypto Basic opinion. Readers are encouraged to do thorough research before making any investment decisions. The Crypto Basic is not responsible for any financial losses.
 Bitcoin
  Ethereum
  Tether
  BNB
BNB  XRP
XRP  USDC
USDC  Solana
  Figure Heloc