

Despite a brief bounce, the price of Bitcoin is still below the pivotal $90,000 mark, which has become a significant resistance lately, capping upside attempts. With recent signals from two key indicators, the slight upward push by the flagship asset may just be the beginning of another major rally.
Key Bitcoin Indicators Are Converging
Bitcoin’s price experienced a bounce on Wednesday, gradually reigniting bullish sentiment across the broader crypto market. It is worth noting that two closely watched indicators are now starting to portray the same story of a renewed bullish market trend.
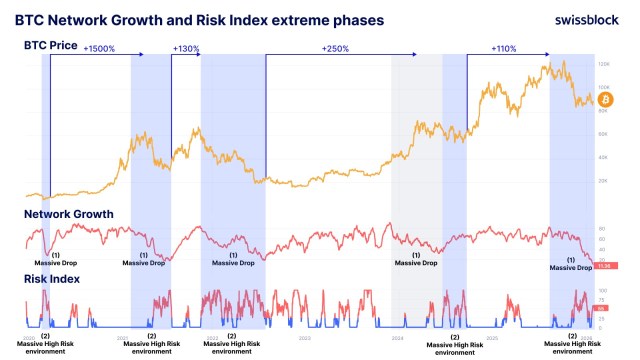
Specifically, the shift is being showcased by the Bitcoin Network Growth and Risk Index. As outlined by the Bitcoin Vector, an institutional market-grade professional, on the X platform, these two crucial indicators are beginning to move in alignment, which is capable of shaping the crypto king’s next price trajectory in the short term.
In the past, the combination of Risk Index and Network Growth has often turned out to be a powerful leading indicator for BTC. This convergence points to a change toward a more balanced market environment where rising risk signals are no longer overpowering growing network activity.
When these key metrics synchronize, it frequently denotes a period of transition that may come before more long-term pricing trends. Currently, the chart shows a significant decline in network growth (1) and a high-risk environment (2), which typically leads to sustained bullish trends.
With BTC traditionally being “late to the party,” the market may be looking at one of the most massive rallies ever recorded in years. In the meantime, these indicators provide a more comprehensive, data-driven understanding of the fundamental health of Bitcoin that goes beyond short-term price swings.
In another post, Bitcoin Vector shared that a significant bullish divergence is forming between BTC and the Relative Strength Index (RSI). The formation of this bullish divergence points to a possible shift in momentum beneath the surface.
Given that similar setups have historically generated over 10% returns on these timeframes, the expert claims that a return to the $95,000 price mark is becoming likely. However, the real signal lies in the confluence. If the market continues to increase in both Network Fundamentals and Liquidity while maintaining BTC Dominance, a major bullish reversal is probably about to begin.
BTC Whales And Retailers’ Activity Diverging
According to current market trends, Bitcoin retail investors are dumping their holdings while large holders or whales are steadily buying more BTC. CW, a market expert, noted that this divergence was observed ahead of the FOMC meeting. However, the brown whale is offloading a small portion of its BTC stash.
During the investors’ action, the BTC sell wall at the $90,000 level has vanished, whereas the sell wall at $86,000 is still active. Nonetheless, a new wall is developing at the $95,000 mark, and volatility will likely happen after 3 hours.

Featured image from Pngtree, chart from Tradingview.com

Editorial Process for bitcoinist is centered on delivering thoroughly researched, accurate, and unbiased content. We uphold strict sourcing standards, and each page undergoes diligent review by our team of top technology experts and seasoned editors. This process ensures the integrity, relevance, and value of our content for our readers.
 Bitcoin
  Ethereum
  Tether
  BNB
BNB  XRP
XRP  USDC
USDC  Solana
  Figure Heloc