

Solana rebounds from a month-long slide, breaking the first Fibonacci resistance as traders watch for the next leg up.
Solana is trying to rebuild momentum after a bruising month-long slide, currently changing hands at $141.87. Over the last 24 hours, SOL has gained about 3.6%, as buyers push price back toward the upper end of its recent $135–$144 range. On a 7-day view, performance is roughly flat with a mild 0.9% pullback that masks a clear dip-and-rebound pattern.
Meanwhile, the 14-day return shows a deeper 8.3% decline, while the 30-day picture is still harsh at around 30.3% in the red. With a market cap near $79 billion and daily volume above $5.8 billion, Solana remains highly liquid, setting the stage for a closer look at whether this rebound can evolve into a sustained recovery.
Can Solana Price Fully Recover?
On the technical end, the daily chart shows Solana is attempting a structured recovery from November’s sell-off. The auto Fibonacci retracement drawn from the recent swing high just above $205 to the low around $121.65 shows SOL now pressing against the 0.236 level around the $141–$142 area. This marks the first meaningful resistance breach of the current bounce.
A confirmed move above this band would open the door toward the next Fibonacci levels at the 0.382 retracement at $153.60, where sellers are likely to re-emerge. If price fails to hold above the 0.236 band, downside focus returns to the recent base at $121, acting as major support.
Further, the Directional Movement Index (DMI) points to weakening bearish conditions. The +DI line at 13.26 sits well below the –DI line at 22.76, indicating that sellers are still present. The ADX above 45 suggests a strong trend, yet the narrowing distance between the two lines signals that bearish momentum may be losing strength. If the +DI line can flip the –DI line, it would signal a clear shift in momentum toward the bulls and strengthen the case for Solana extending its recovery.
Can Solana Outperform Bitcoin?
Elsewhere, with Solana finally recovering, a market watcher account, curb.sol, points to a breakout on the SOL/BTC pair. His chart on X shows the ratio pushing above a multi-month descending trendline, suggesting that Solana may be starting to outperform Bitcoin after an extended period of relative weakness. The chart points to a potential pump in the SOL/BTC pair toward roughly the 0.0035 to 0.0036 BTC per SOL area.
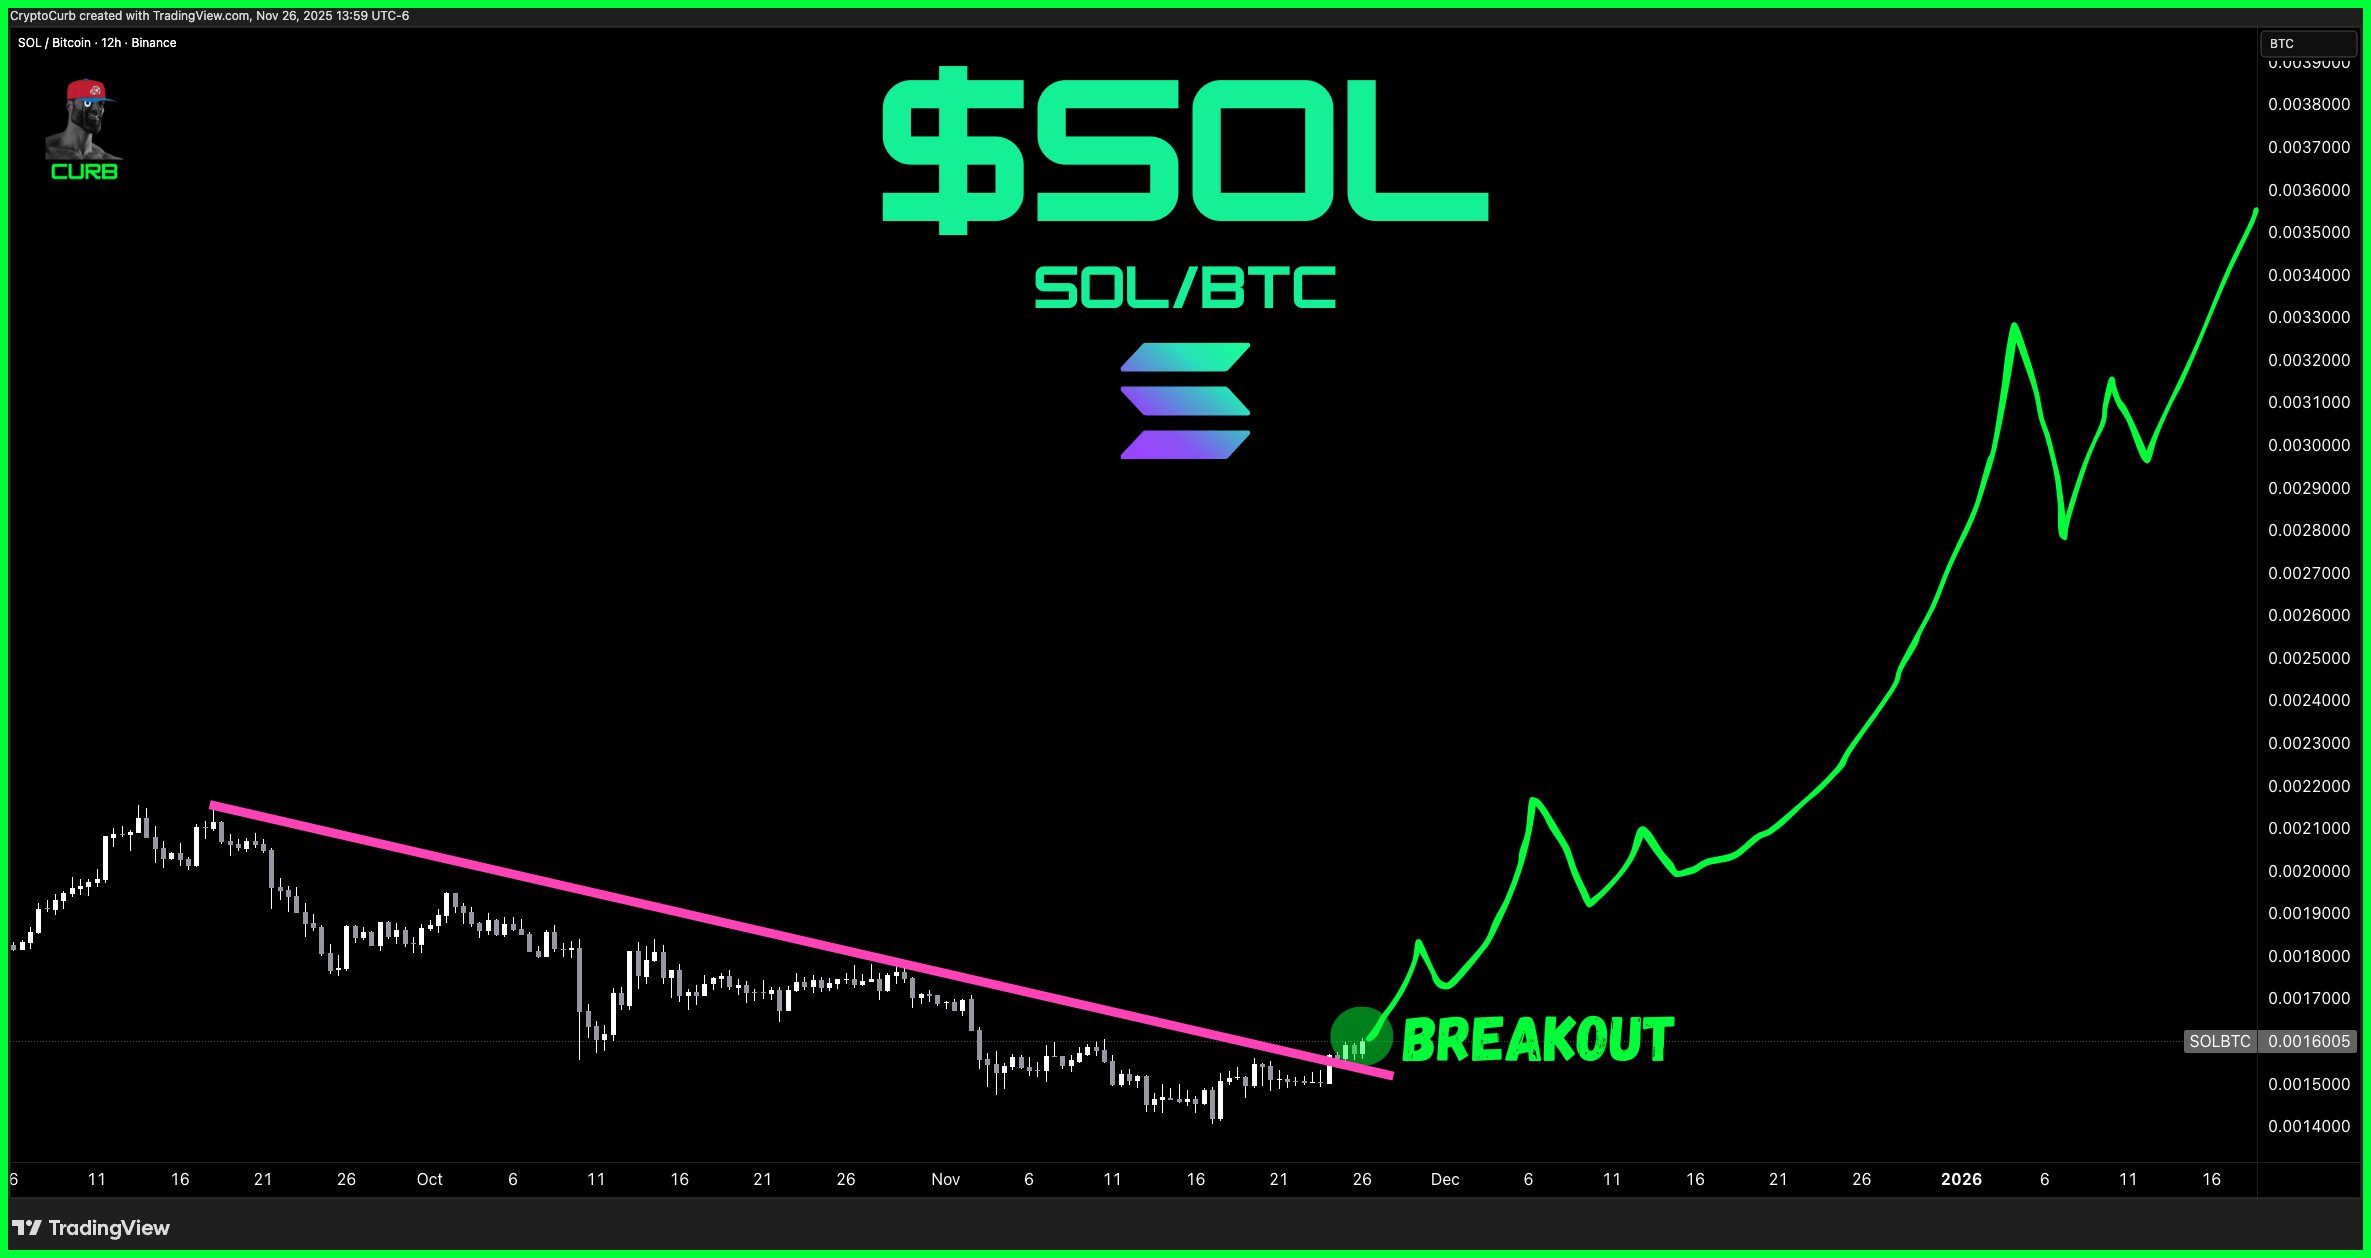
In his post, the market watcher calls the move “probably something” and even suggests that traders holding only BTC should consider pivoting to SOL. While the comment is speculative and not guaranteed, it underlines growing sentiment that Solana could lead the next leg higher if this breakout on the SOL/BTC chart holds.
DisClamier: This content is informational and should not be considered financial advice. The views expressed in this article may include the author’s personal opinions and do not reflect The Crypto Basic opinion. Readers are encouraged to do thorough research before making any investment decisions. The Crypto Basic is not responsible for any financial losses.
 Bitcoin
  Ethereum
  Tether
  BNB
BNB  XRP
XRP  USDC
USDC  Solana
  Figure Heloc