Multiple analysts have observed that XRP is closely mirroring its 2017 patterns, suggesting a promising future for the asset.
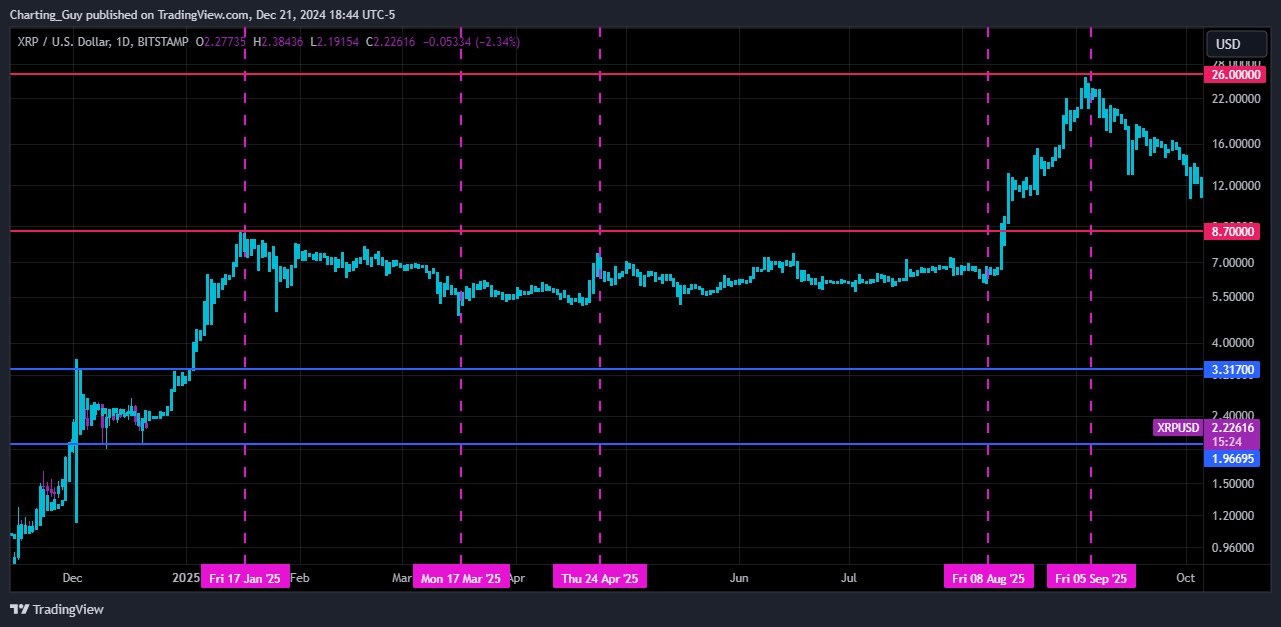
One such analyst, Charting Guy, a widely followed technical expert, has highlighted key pivot dates in XRP’s 2017 fractal.
According to him, if XRP continues to follow the same trajectory it has since last month, it could reach a new all-time high on its next leg up. He speculated that this could happen as early as January, less than two weeks away.
XRP Now vs. 2017
Notably, XRP’s historic bull run in 2017 gained momentum between November and December, with the asset establishing its all-time high by the first week of January. During this period, XRP surged from $0.1838 to $3.84, representing a massive increase of 1,989% over ten weeks.
In comparison, from November to December this year, XRP has already risen by 491%, from $0.49 to $2.90. Currently, XRP is in a consolidation phase, with market analysts anticipating a major breakout toward a new all-time high.
Bold Projections for XRP Based on 2017 Patterns
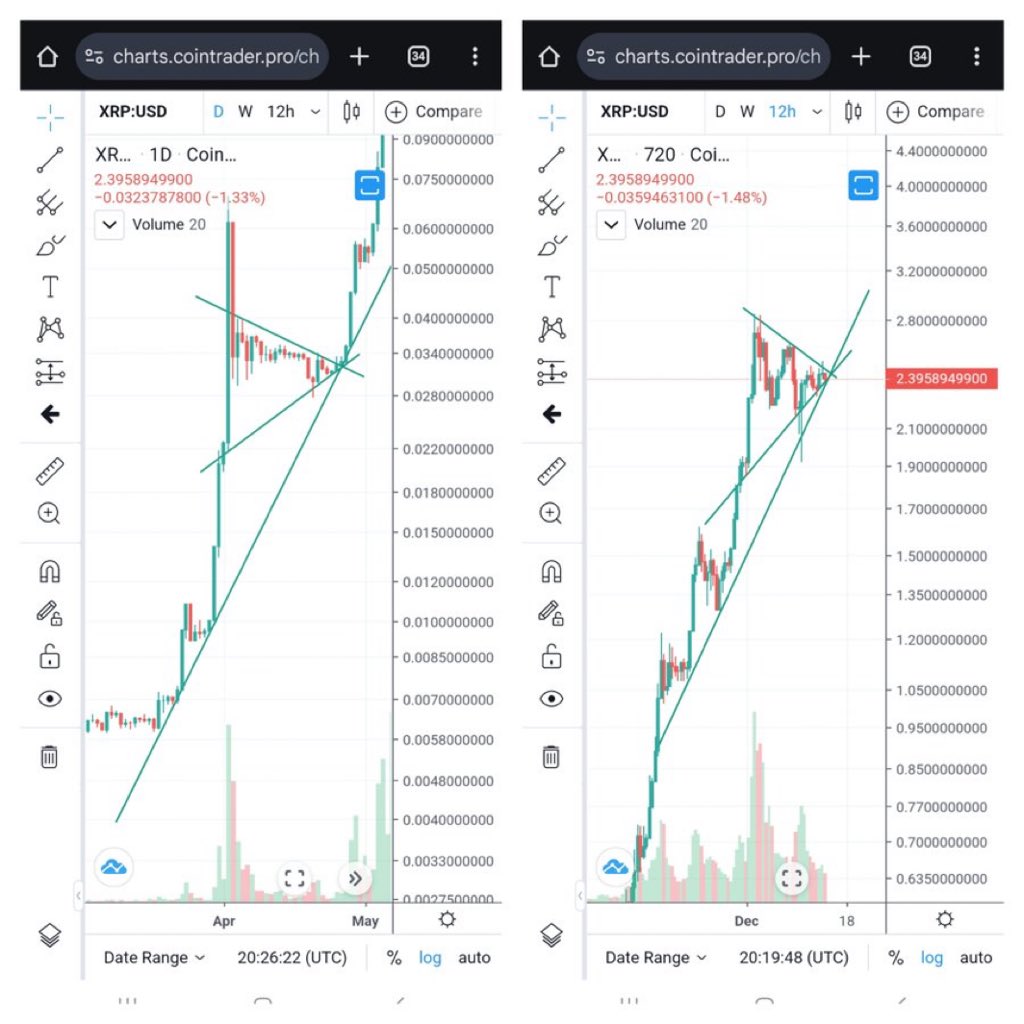
Crypto Vilian, a market analyst from Cambridge, has also identified promising signs for XRP based on 2017’s market structure. He pointed out the sequence of a bearish decline, recovery, consolidation, and a subsequent breakout that mirrors the current situation with XRP.
His chart suggests that, when the bulls return, XRP could attain a $1.05 trillion market cap. This lofty market cap corresponds to a floor price of around $17 for XRP.
However, Vilian noted that this optimistic outlook depends heavily on Bitcoin’s performance. He further identified potential price levels between $8 and $13 for XRP, with the possibility of a three-fold price surge if the asset breaks through this range.
Forecast for XRP 4,250% Surge to $100+
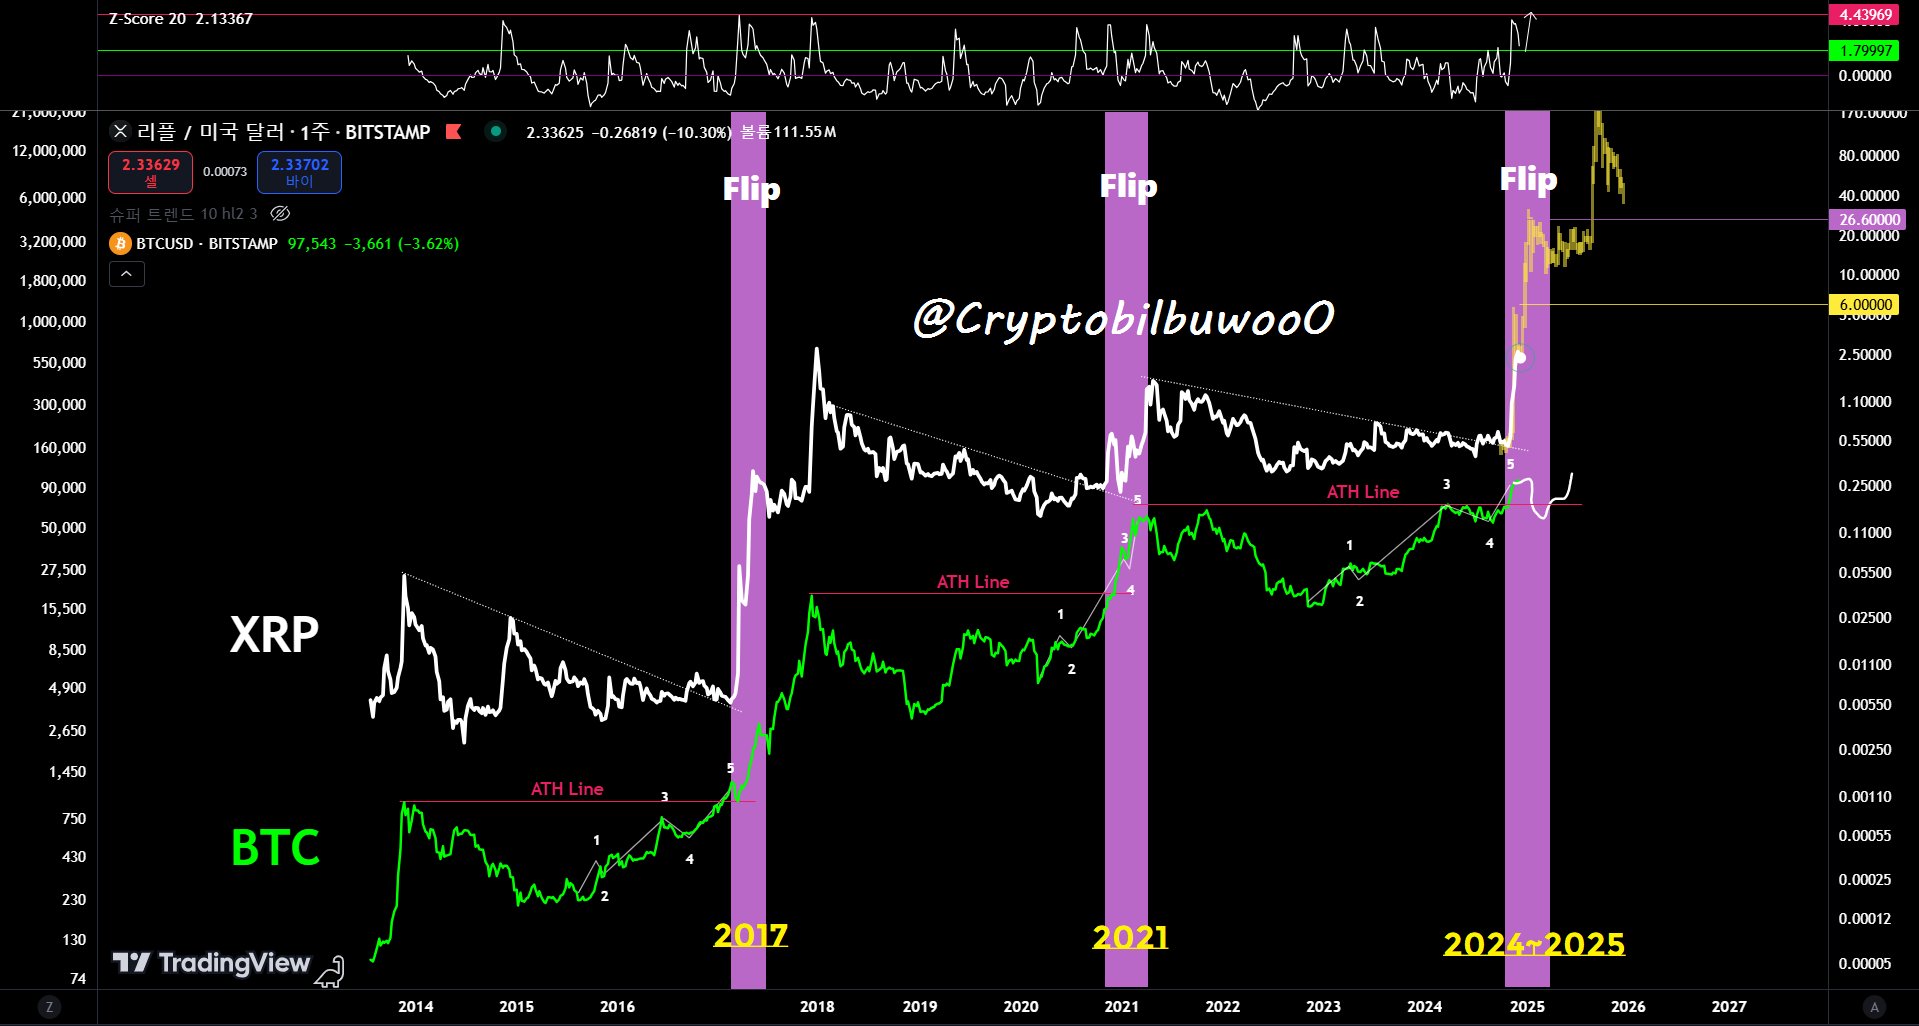
Meanwhile, analyst Crypto Bilbuwoo has proposed an even more ambitious target. While other analysts take a more conservative approach, Bilbuwoo’s chart predicts a scenario where XRP follows the 2017 trend, with initial peaks around $26, followed by a correction.
After that, the asset could soar above $100, according to his chart.

At press time, XRP is trading at $2.13. Attaining above $100 demands a growth of over 4,250%.
The Charting Guy suggests that XRP’s current price movement closely resembles its behavior during the 2017 bull market. Based on this fractal pattern and key pivot dates from 2017, he predicts that if XRP continues to follow this trend, it could reach a new all-time high during its next upward movement, expected later in January 2025.

The below-mentioned chart below shows the similarities between the 2017 and 2024 XRP price movements.

However, This more extreme projection has faced criticism. Some critics argue that XRP should first break its seven-year all-time high before considering such lofty price targets.
“People posting charts like this showing $100+ have no idea how markets work. That would take years if it ever happens,” said X user Daniel G.
DisClamier: This content is informational and should not be considered financial advice. The views expressed in this article may include the author’s personal opinions and do not reflect The Crypto Basic opinion. Readers are encouraged to do thorough research before making any investment decisions. The Crypto Basic is not responsible for any financial losses.


 Bitcoin
  Ethereum
  XRP
XRP  Tether
  Solana
  USDC
USDC  Dogecoin
  Lido Staked Ether
  Cardano