- Dogecoin price broke out of a descending triangle pattern on March 1.
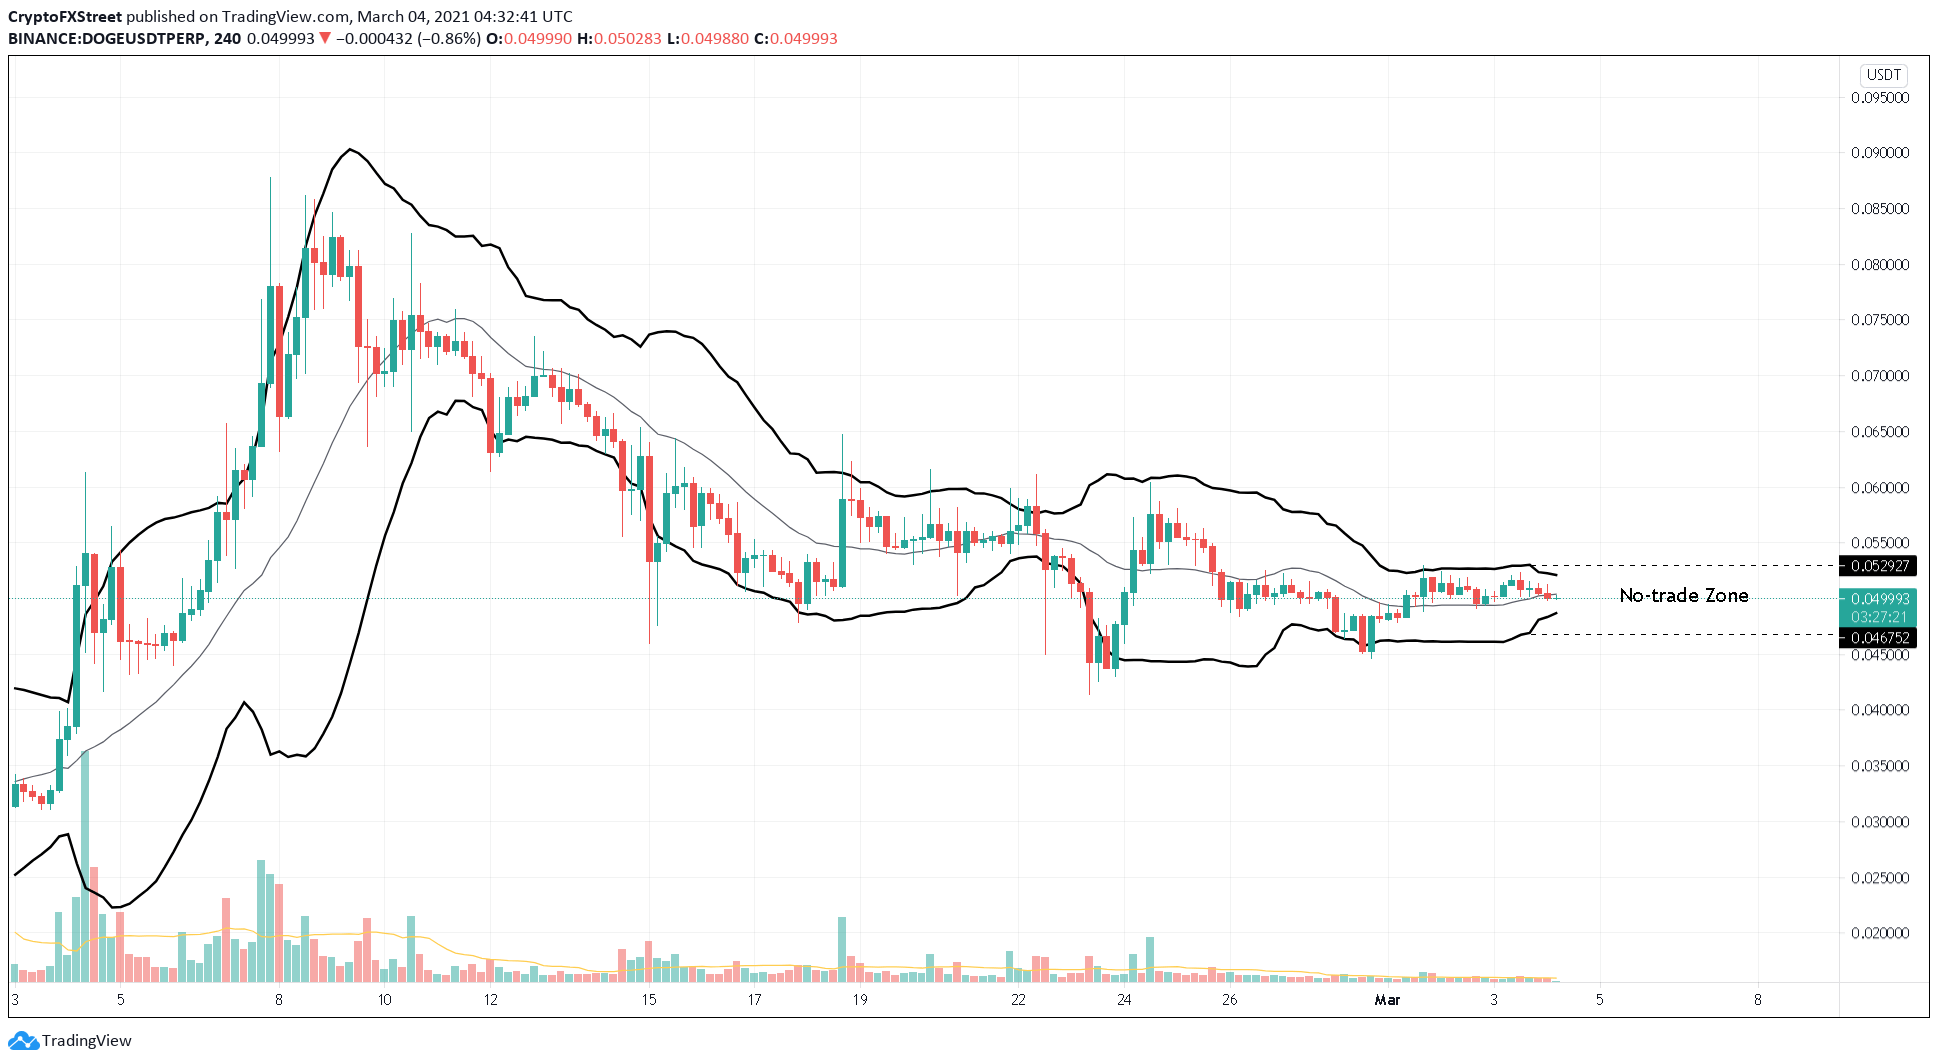
- Due to lack of volatility, as displayed by the Bollinger Bands, DOGE’s bull rally is put-off.
- A decisive close above the no-trade zone will determine the meme coin’s direction.
Dogecoin price has been traversing the descending triangle formation for more than 20 days—however, the recent swing high lead to a bullish breakout. Now DOGE eyes a 50% upswing to $0.076.
Dogecoin price in search of volatility
Dogecoin price has been consolidating, forming a series of lower highs that have bounced off a horizontal demand barrier at $0.043. Connecting these swing highs and flat support using trendlines results in a descending triangle pattern.
The technical formation forecasts a 50% upswing determined by measuring the distance between the pivot high and the horizontal support line and adding it to the breakout point at $0.050.
This target places DOGE at $0.076.
However, unlike in early January and February, Dogecoin price seems to be dead in the water, despite its recent breakout from consolidation.
DOGE/USDT 4-hour chart
At the time of writing, Dogecoin price is getting squeezed by the Bollinger Bands. The reduction of distance between the upper and lower band indicates a period of low volatility, which explains DOGE’s lackluster performance.
So long as Dogecoin price trades within the no-trade zone that extends from $0.046 to $0.052, significant swings can’t be expected. However, a 4-hour candlestick close above the range confirms an upswing and the resurgence of volatility.
In such a case, DOGE could surge towards its intended target at $0.076.
DOGE/USDT 4-hour chart
On the flip side, if Dogecoin price slices through the lower range of the no-trade zone at $0.046, then a 12% downswing to $0.043 is possible. A spike in selling pressure here could invalidate the bullish thesis and lead to a steep 50% correction to $0.021.


 Bitcoin
  Ethereum
  Tether
  XRP
XRP  Solana
  USDC
USDC  Dogecoin
  Cardano
  TRON
TRON